- Home >
- Stock Photos >
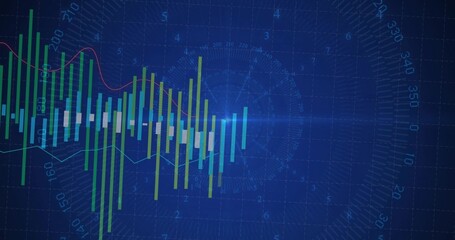
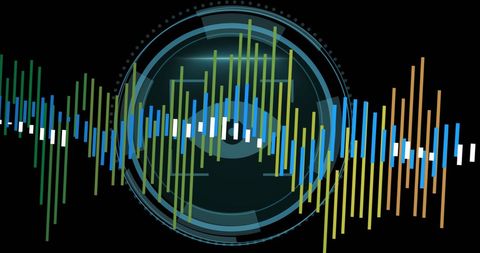
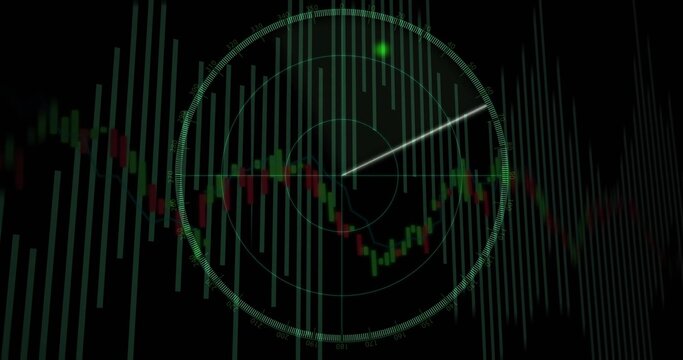
- Futuristic Radar Display with Financial Analytics Overlay
Futuristic Radar Display with Financial Analytics Overlay Image
Digital combines radar screen format and financial charts, prominently featuring a rotating scan beam overlay with candlestick and bar charts. Captures technological aspect of data visualization and monitoring, useful for concepts in cybersecurity and finance industries. Ideal for illustrating topics in financial analytics, digital dashboards, and futuristic technology presentations. Suitable for backgrounds in cybersecurity reports, finance technology videos, and investment analysis posts.
Powered by 


downloads
Tags:
More
Credit Photo
If you would like to credit the Photo, here are some ways you can do so
Text Link
photo Link
<span class="text-link">
<span>
<a target="_blank" href=https://pikwizard.com/photo/futuristic-radar-display-with-financial-analytics-overlay/2d35f94dae5a0fb7fcdbf17f12dc3cfb/>PikWizard</a>
</span>
</span>
<span class="image-link">
<span
style="margin: 0 0 20px 0; display: inline-block; vertical-align: middle; width: 100%;"
>
<a
target="_blank"
href="https://pikwizard.com/photo/futuristic-radar-display-with-financial-analytics-overlay/2d35f94dae5a0fb7fcdbf17f12dc3cfb/"
style="text-decoration: none; font-size: 10px; margin: 0;"
>
<img src="https://pikwizard.com/pw/medium/2d35f94dae5a0fb7fcdbf17f12dc3cfb.jpg" style="margin: 0; width: 100%;" alt="" />
<p style="font-size: 12px; margin: 0;">PikWizard</p>
</a>
</span>
</span>
Free (free of charge)
Free for personal and commercial use.
Author: People Creations