
- Home >
- Stock Photos >
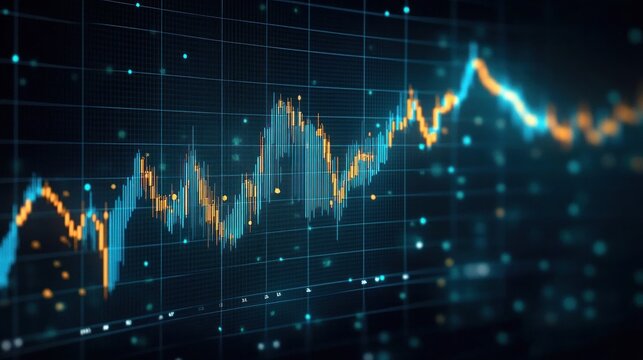
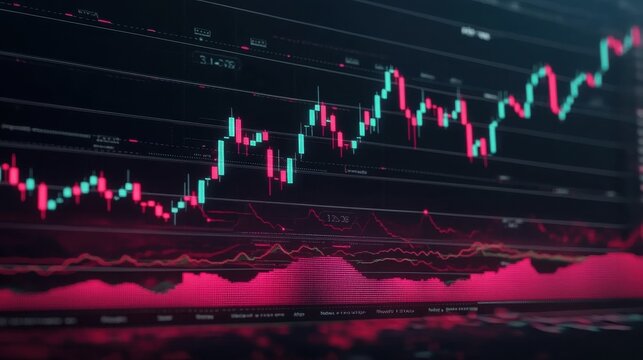
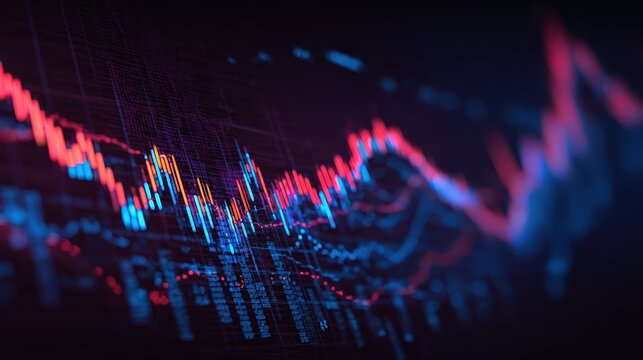
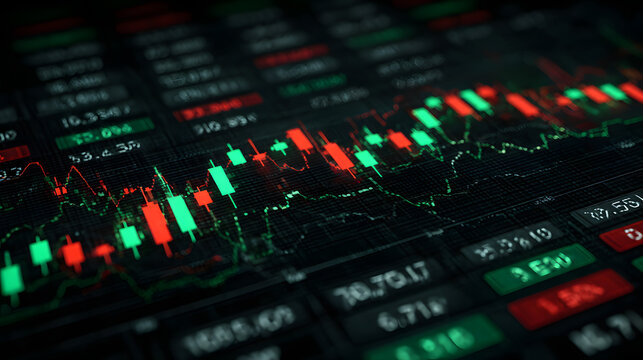
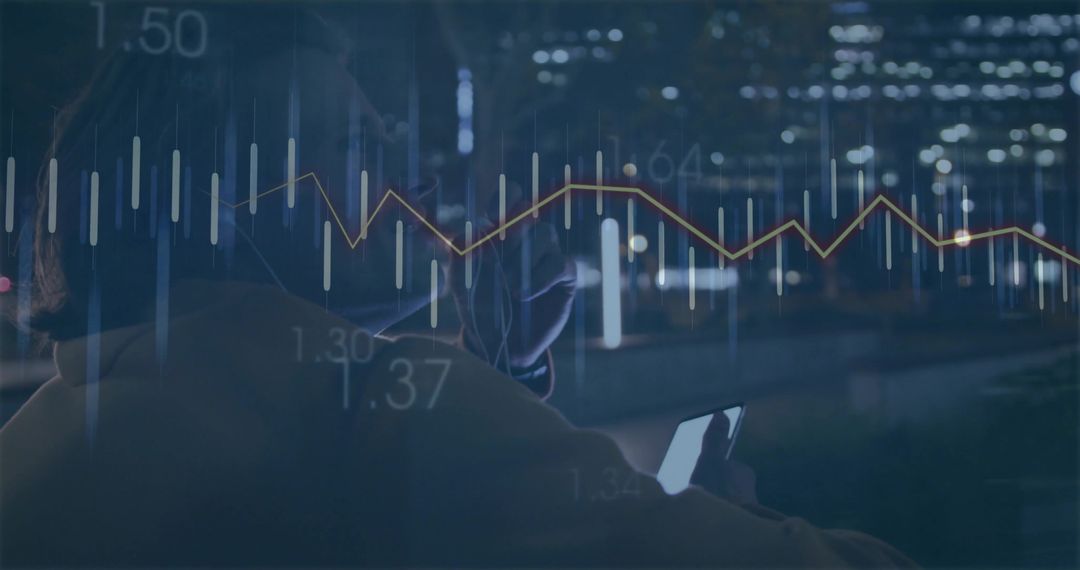
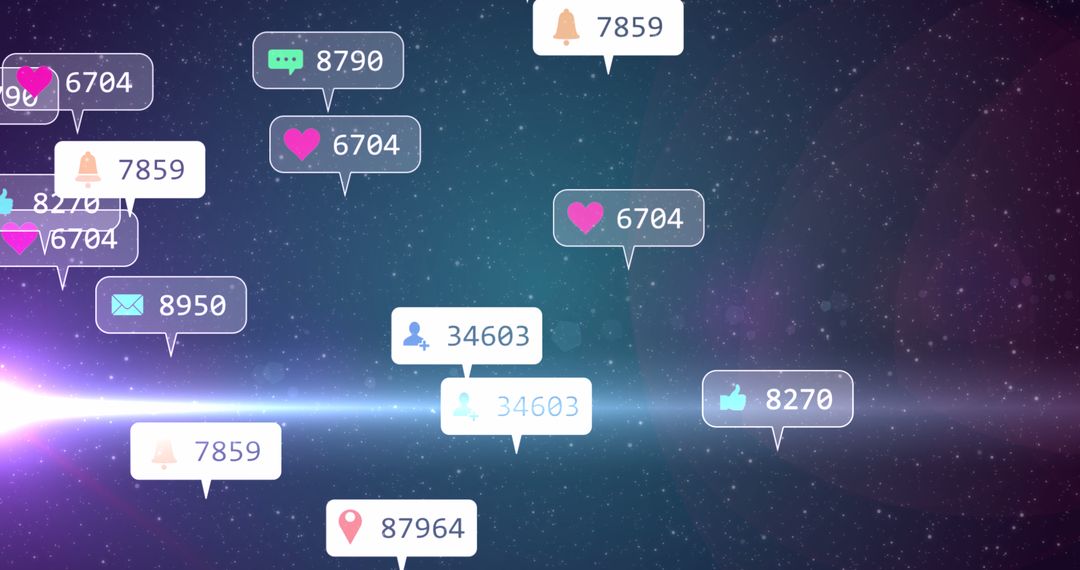
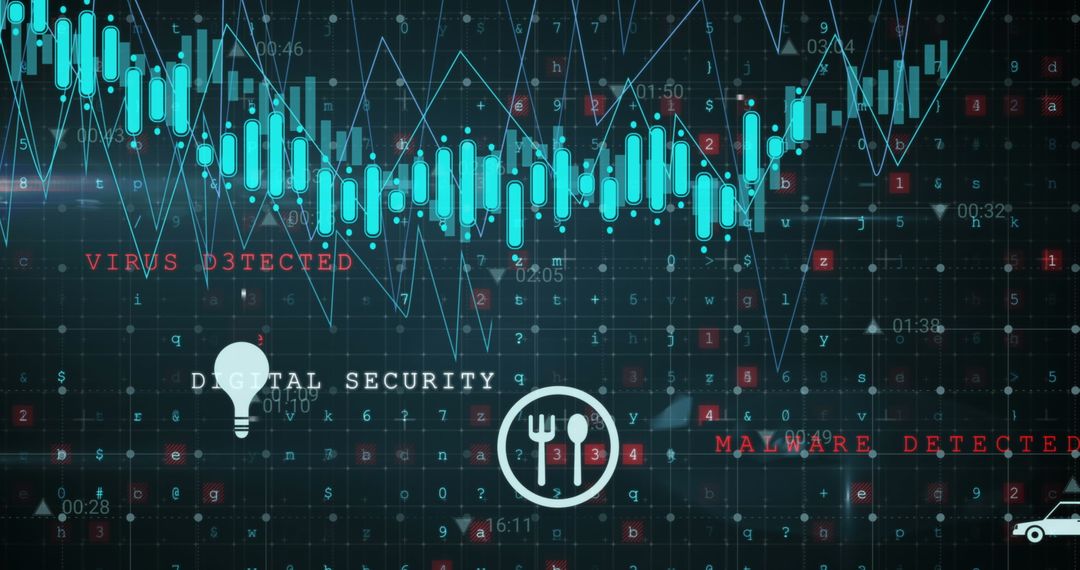
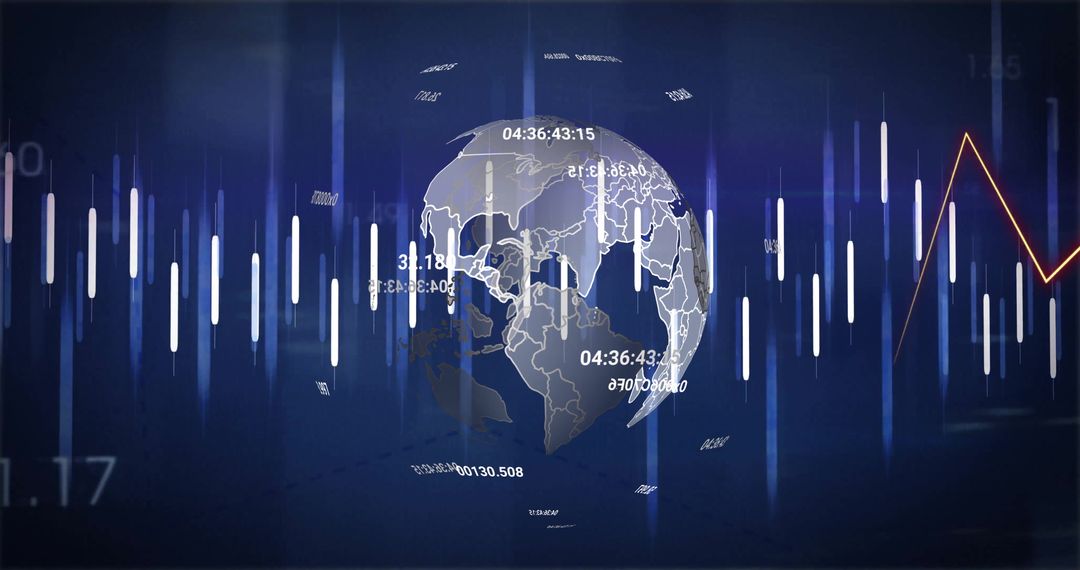
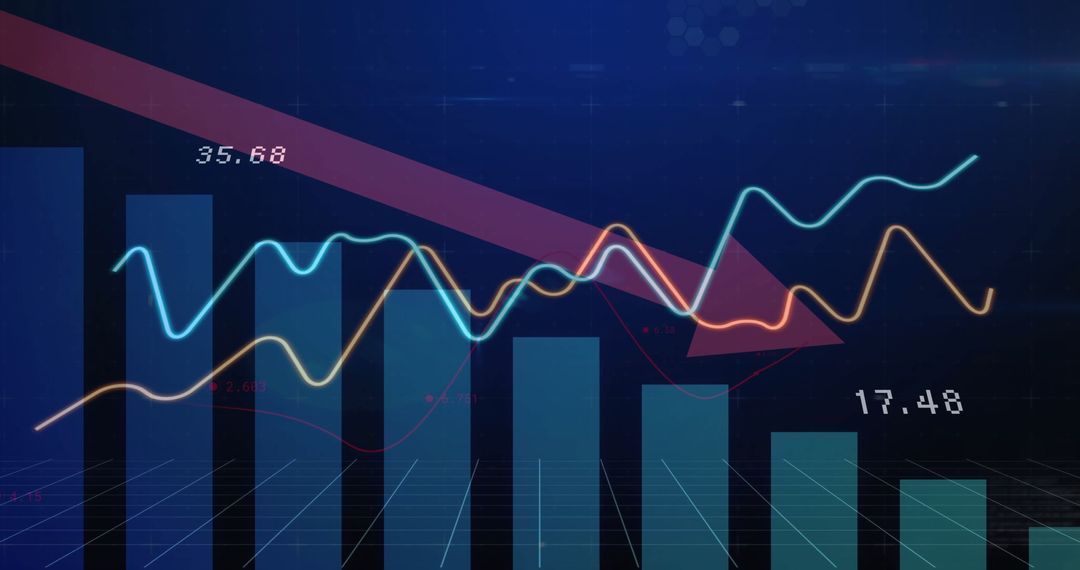
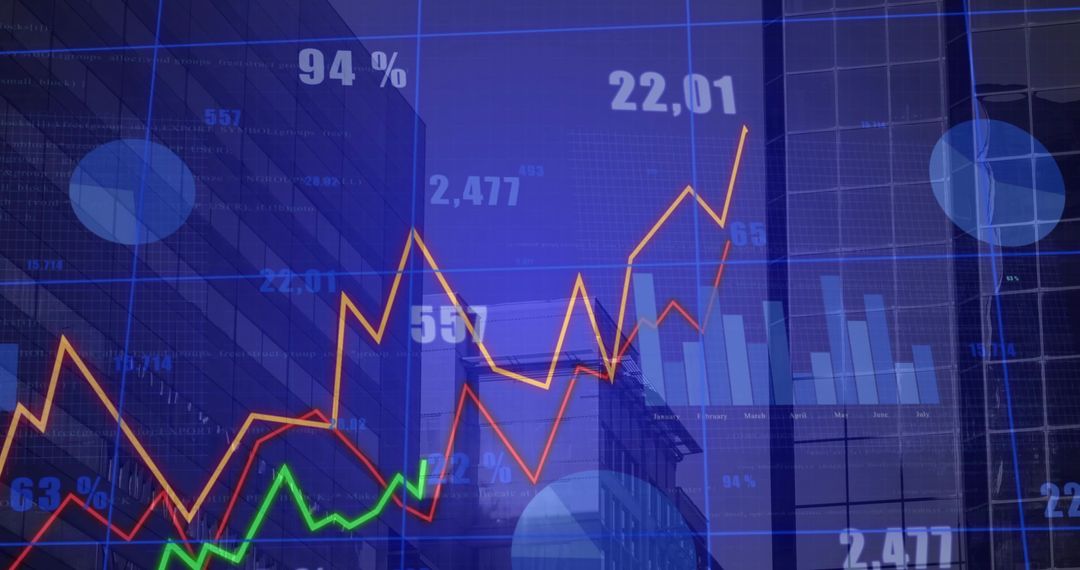
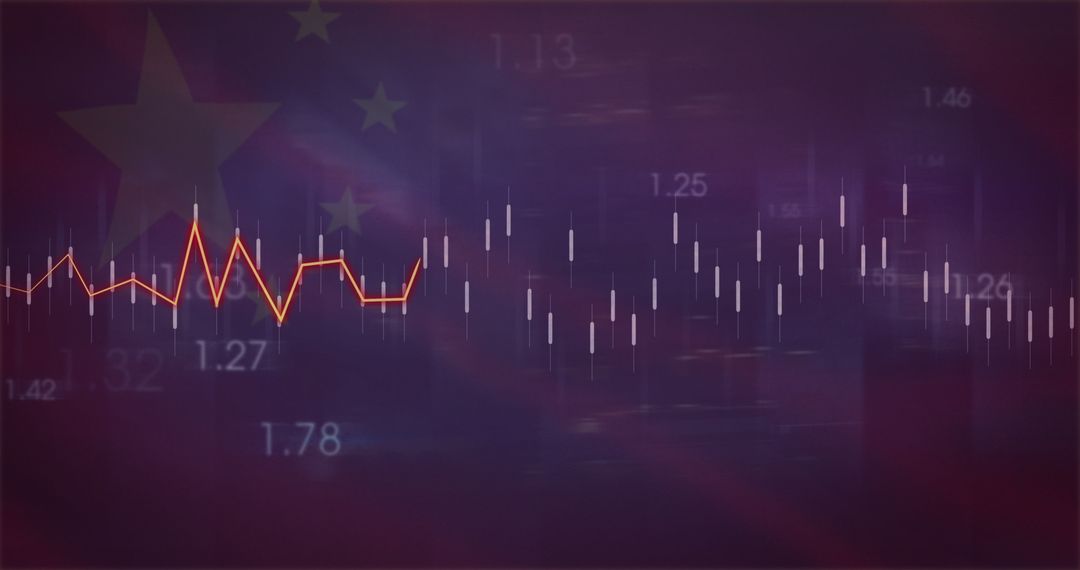
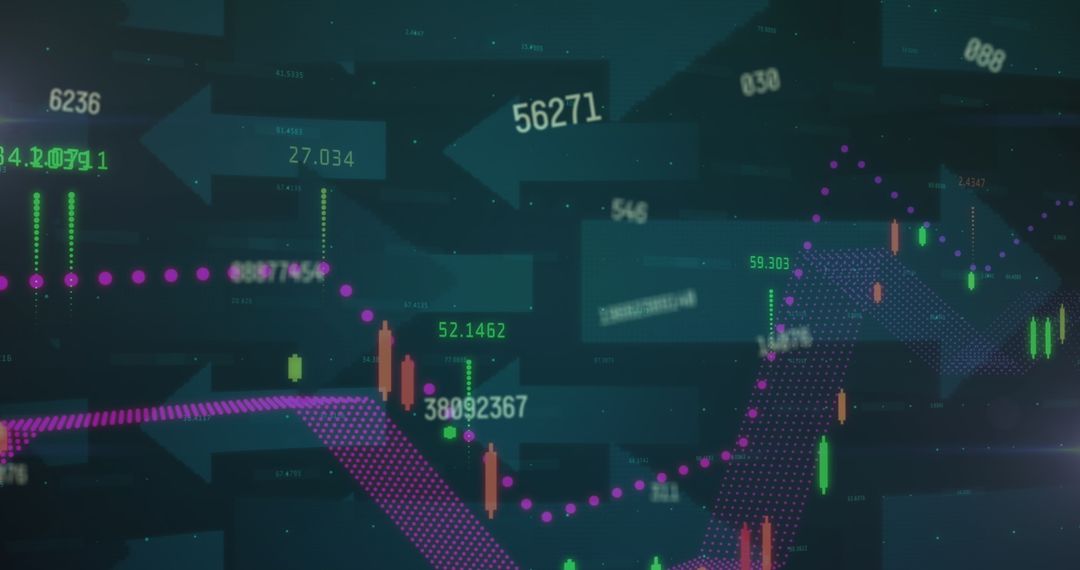
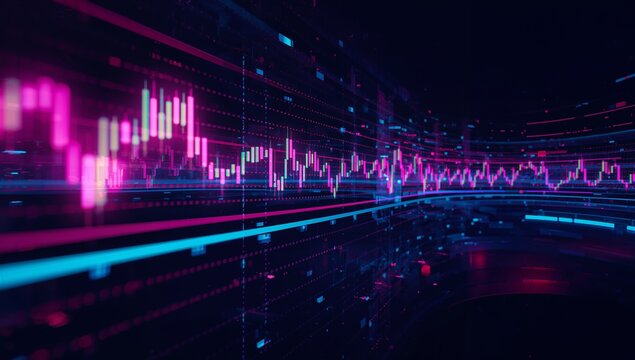
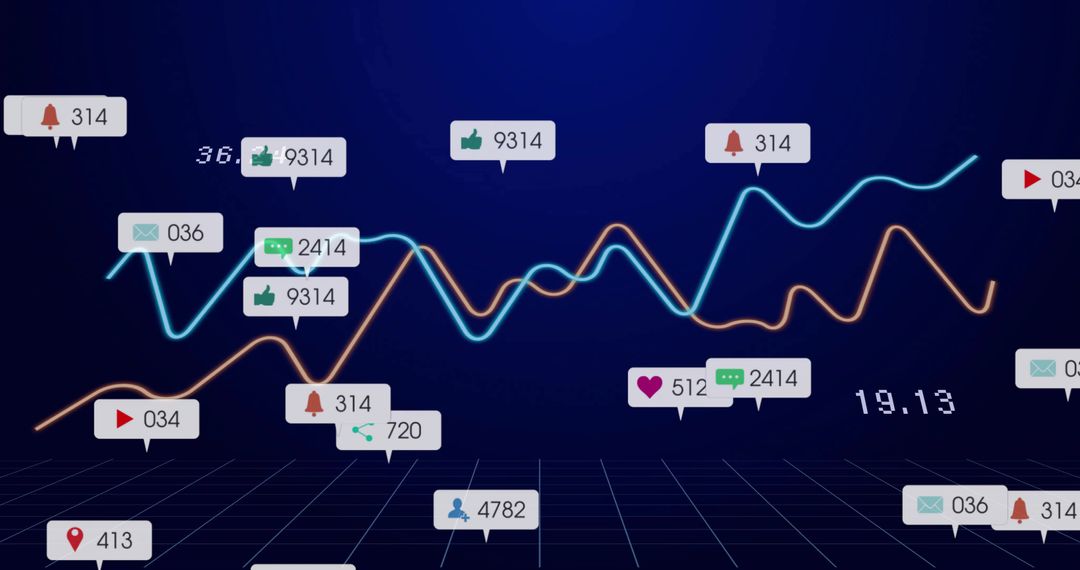
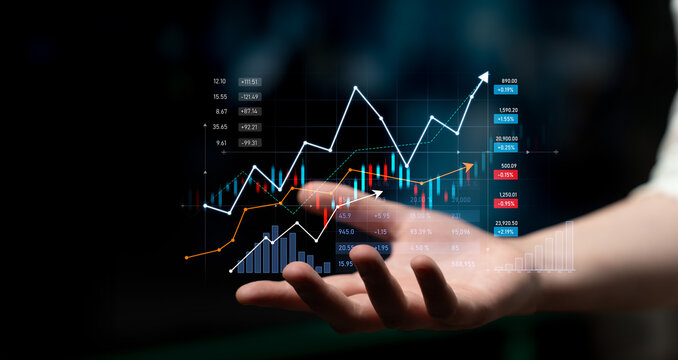
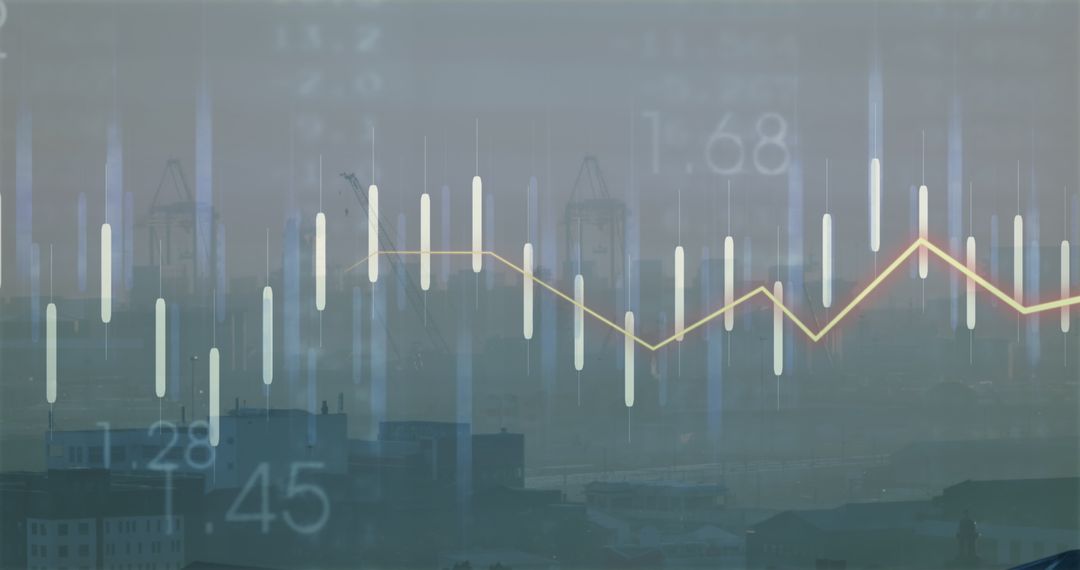
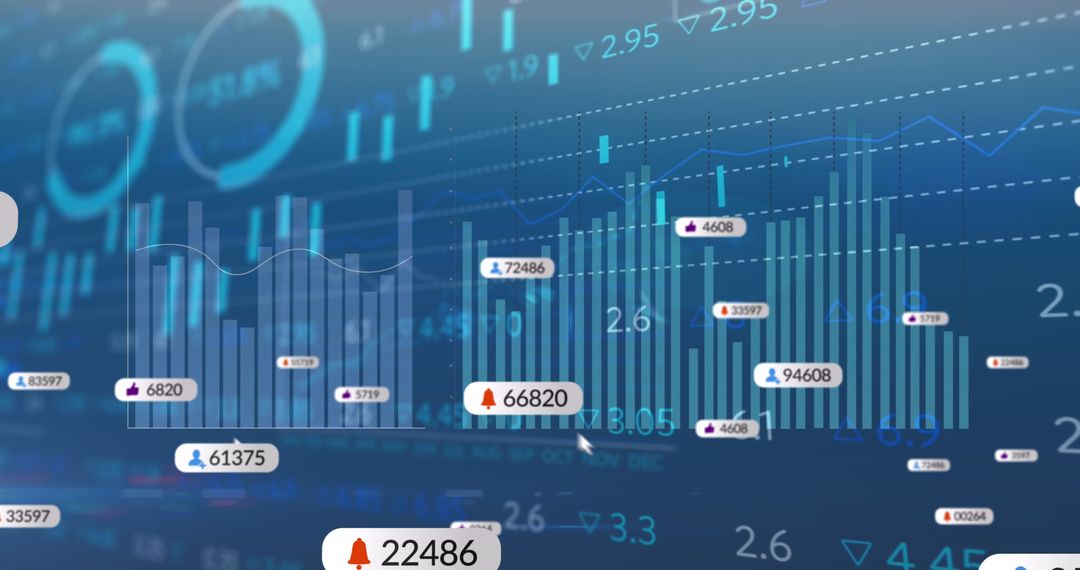
- Futuristic Realtime Analytics Dashboard Displaying Candlestick Chart, Trend Line, Alerts
Futuristic Realtime Analytics Dashboard Displaying Candlestick Chart, Trend Line, Alerts Image
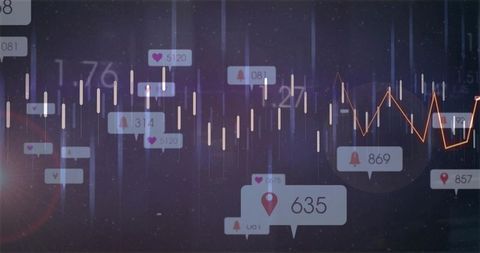
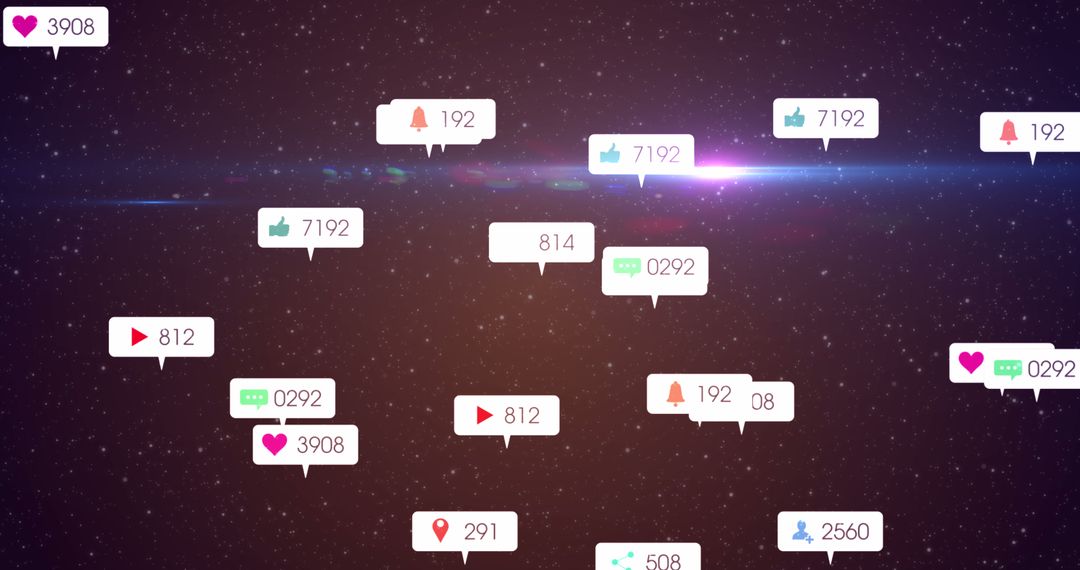
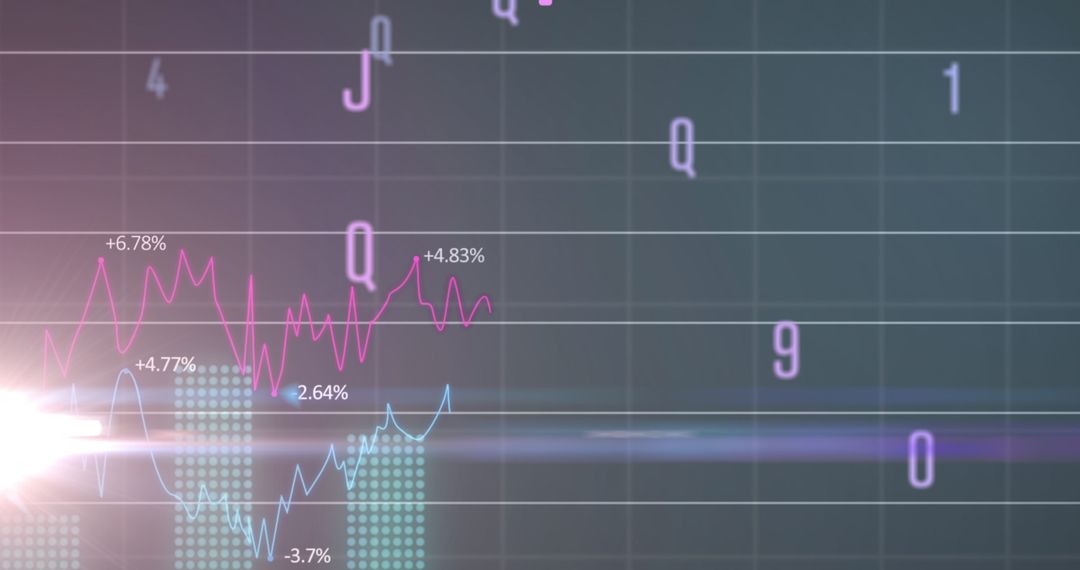
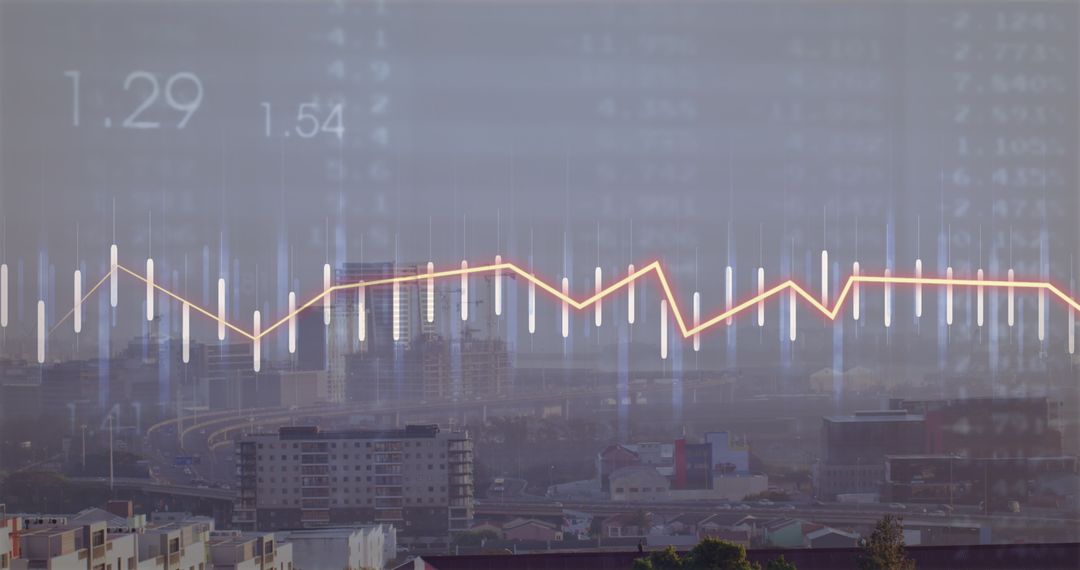
Dark neon dashboard displaying candlestick bars, glowing orange trend line, floating speech tags with numeric metrics, heart icons, alert bells and geotag pins. Vertical light streaks and subtle grain adding futuristic tech mood while layered overlays create depth and clarity for complex data. Composition emphasizing realtime monitoring, pattern detection and performance tracking for trading or analytics contexts. Ideal for use in fintech website hero banners, app interface mockups, investor presentations, marketing for trading platforms, blog posts about market analysis, social media posts explaining data trends, and educational slides about candlestick reading. Helpful for design templates, editorial layouts, pitch decks, and UI concept galleries needing modern tech aesthetic.
Powered by 


0
downloads
downloads
Tags:
More
Credit Photo
If you would like to credit the Photo, here are some ways you can do so
Text Link
photo Link
<span class="text-link">
<span>
<a target="_blank" href=https://pikwizard.com/photo/futuristic-realtime-analytics-dashboard-displaying-candlestick-chart-trend-line-alerts/68606396ac3b3052726fbddde8665536/>PikWizard</a>
</span>
</span>
<span class="image-link">
<span
style="margin: 0 0 20px 0; display: inline-block; vertical-align: middle; width: 100%;"
>
<a
target="_blank"
href="https://pikwizard.com/photo/futuristic-realtime-analytics-dashboard-displaying-candlestick-chart-trend-line-alerts/68606396ac3b3052726fbddde8665536/"
style="text-decoration: none; font-size: 10px; margin: 0;"
>
<img src="https://pikwizard.com/pw/medium/68606396ac3b3052726fbddde8665536.jpg" style="margin: 0; width: 100%;" alt="" />
<p style="font-size: 12px; margin: 0;">PikWizard</p>
</a>
</span>
</span>
Free (free of charge)
Free for personal and commercial use.
Author: Creative Art
Similar Free Stock Images

Premium


Premium
Premium


Premium


Premium

Premium

Premium


Premium


Premium


Premium


Premium

Premium


Premium

Premium


Premium


Premium


Premium


Premium


Premium


Premium


Premium


Premium


Premium


Premium

