- Home >
- Stock Photos >
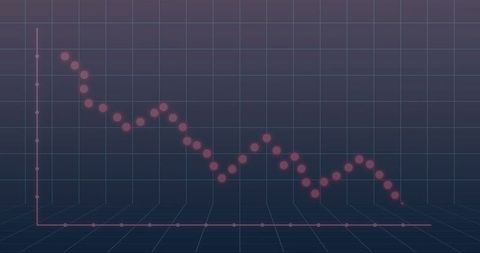
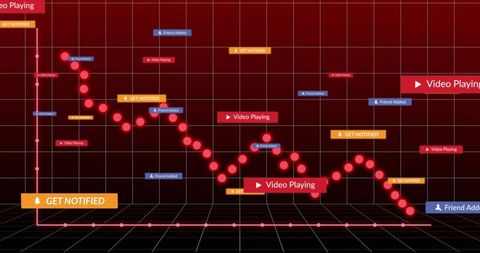
- Futuristic Red Line Graph with 3D Data Grid Elements
Futuristic Red Line Graph with 3D Data Grid Elements Image

This representation of a jagged red line graph in a virtual 3D data grid depicts a futuristic and immersive digital environment. It highlights analytics and data visualization in a high-tech context, making it ideal for presentations, technology articles, or educational materials focusing on digital trends and analysis.

downloads
Tags:
More
Credit Photo
If you would like to credit the Photo, here are some ways you can do so
Text Link
photo Link
<span class="text-link">
<span>
<a target="_blank" href=https://pikwizard.com/photo/futuristic-red-line-graph-with-3d-data-grid-elements/8e0a294ccacdff2f41b81a17ceb89f75/>PikWizard</a>
</span>
</span>
<span class="image-link">
<span
style="margin: 0 0 20px 0; display: inline-block; vertical-align: middle; width: 100%;"
>
<a
target="_blank"
href="https://pikwizard.com/photo/futuristic-red-line-graph-with-3d-data-grid-elements/8e0a294ccacdff2f41b81a17ceb89f75/"
style="text-decoration: none; font-size: 10px; margin: 0;"
>
<img src="https://pikwizard.com/pw/medium/8e0a294ccacdff2f41b81a17ceb89f75.jpg" style="margin: 0; width: 100%;" alt="" />
<p style="font-size: 12px; margin: 0;">PikWizard</p>
</a>
</span>
</span>
Free (free of charge)
Free for personal and commercial use.
Author: Creative Art