- Home >
- Stock Photos >
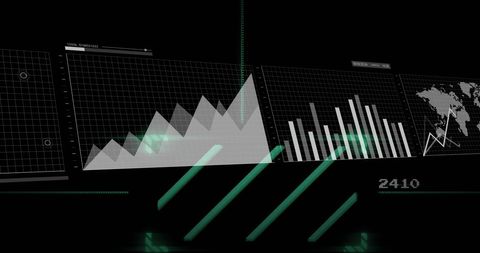
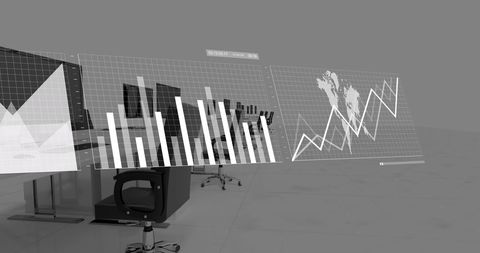
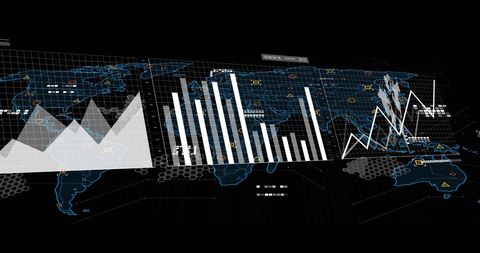
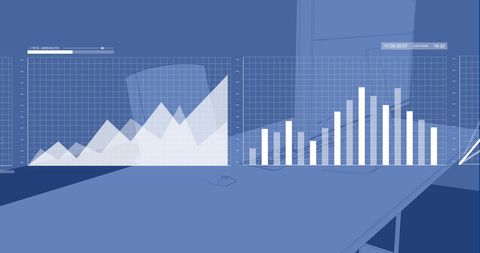
- Futuristic Statistical Data Interface in Modern Empty Office
Futuristic Statistical Data Interface in Modern Empty Office Image

Futuristic interface displays statistical data in a sleek modern empty office environment. Features bar charts and line graphs representing diverse business data points. Reflects innovation and the integration of advanced technology in contemporary workspaces. Ideal for use in technology-focused presentations, business strategy meetings, creative designs, and digital marketing materials.

downloads
Tags:
More
Credit Photo
If you would like to credit the Photo, here are some ways you can do so
Text Link
photo Link
<span class="text-link">
<span>
<a target="_blank" href=https://pikwizard.com/photo/futuristic-statistical-data-interface-in-modern-empty-office/e6ef3c01662863664c879760c5fbcbb7/>PikWizard</a>
</span>
</span>
<span class="image-link">
<span
style="margin: 0 0 20px 0; display: inline-block; vertical-align: middle; width: 100%;"
>
<a
target="_blank"
href="https://pikwizard.com/photo/futuristic-statistical-data-interface-in-modern-empty-office/e6ef3c01662863664c879760c5fbcbb7/"
style="text-decoration: none; font-size: 10px; margin: 0;"
>
<img src="https://pikwizard.com/pw/medium/e6ef3c01662863664c879760c5fbcbb7.jpg" style="margin: 0; width: 100%;" alt="" />
<p style="font-size: 12px; margin: 0;">PikWizard</p>
</a>
</span>
</span>
Free (free of charge)
Free for personal and commercial use.
Author: Awesome Content