
- Home >
- Stock Photos >
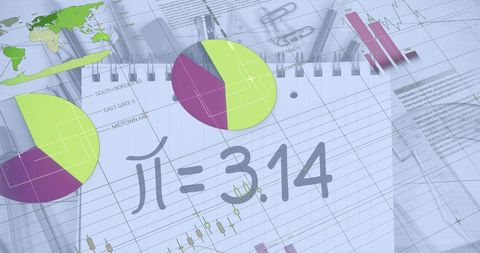
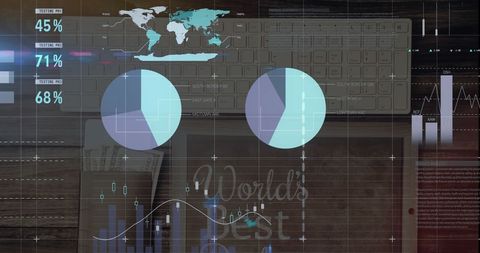
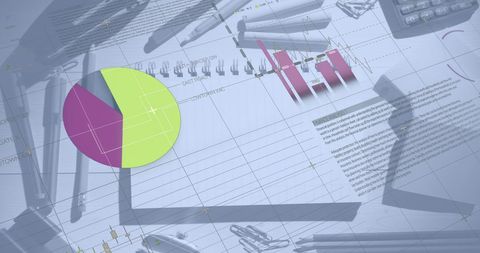
- Futuristic Statistical Data Overlay on Office Desk
Futuristic Statistical Data Overlay on Office Desk Image

Workspace featuring digital graphs and analytics merging with physical office items like notebook, calculator, and coffee cup. Ideal for illustrating technology integration in business, financial analysis software, or modern data visualization in professional settings.
Powered by 


downloads
Tags:
More
Credit Photo
If you would like to credit the Photo, here are some ways you can do so
Text Link
photo Link
<span class="text-link">
<span>
<a target="_blank" href=https://pikwizard.com/photo/futuristic-statistical-data-overlay-on-office-desk/d6aba5d43fb48ca7a309d7ca0ac8192d/>PikWizard</a>
</span>
</span>
<span class="image-link">
<span
style="margin: 0 0 20px 0; display: inline-block; vertical-align: middle; width: 100%;"
>
<a
target="_blank"
href="https://pikwizard.com/photo/futuristic-statistical-data-overlay-on-office-desk/d6aba5d43fb48ca7a309d7ca0ac8192d/"
style="text-decoration: none; font-size: 10px; margin: 0;"
>
<img src="https://pikwizard.com/pw/medium/d6aba5d43fb48ca7a309d7ca0ac8192d.jpg" style="margin: 0; width: 100%;" alt="" />
<p style="font-size: 12px; margin: 0;">PikWizard</p>
</a>
</span>
</span>
Free (free of charge)
Free for personal and commercial use.
Author: People Creations
Similar Free Stock Images

Premium


Premium


Premium


Premium


Premium


Premium


Premium

Premium


Premium

Premium


Premium


Premium

Premium

Premium


Premium

Premium


Premium


Premium


Premium


Premium


Premium


Premium


Premium


Premium


Premium


Explore More Free Stock Images