
- Home >
- Stock Photos >
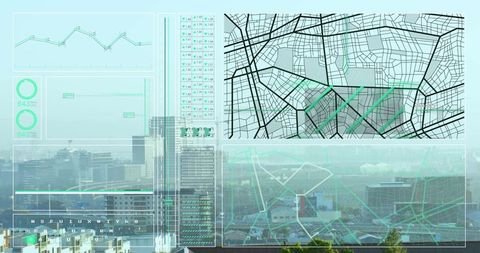
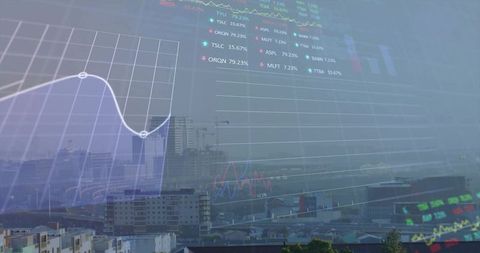
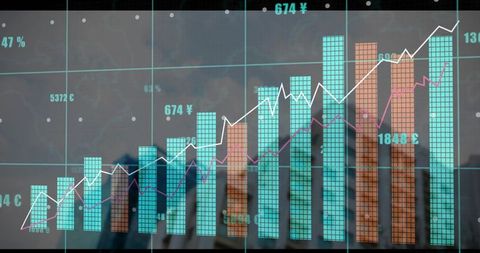
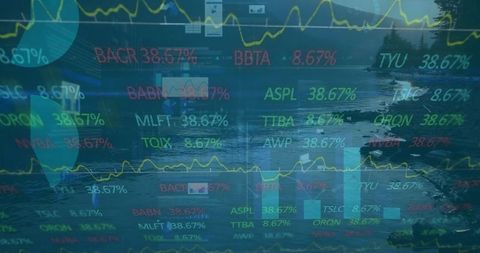
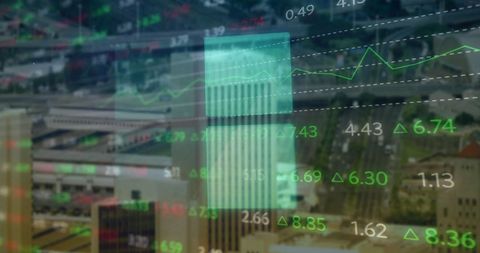
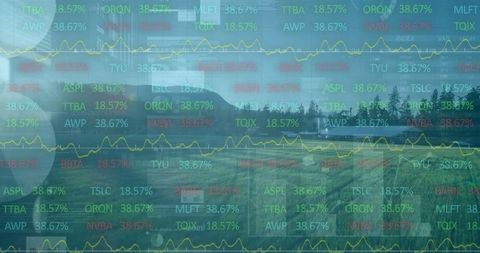
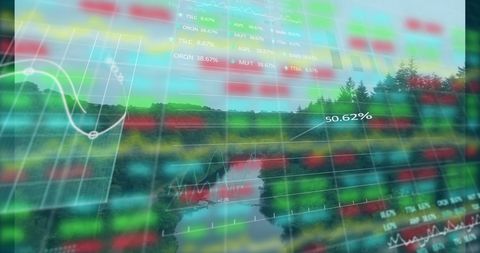
- Futuristic Stock Market Chart and Data Interface
Futuristic Stock Market Chart and Data Interface Image

Vital resource for finance-related content, reports, and presentations. Offers a dynamic depiction of stock market, emphasizing its volatility and complexity. Effective for illustrating financial trends and digital trades, useful in seminars concentrated on investment and financial growth strategies.
Powered by 


downloads
Tags:
More
Credit Photo
If you would like to credit the Photo, here are some ways you can do so
Text Link
photo Link
<span class="text-link">
<span>
<a target="_blank" href=https://pikwizard.com/photo/futuristic-stock-market-chart-and-data-interface/e4e1a6009bc5177d5467e788fc3ce6dd/>PikWizard</a>
</span>
</span>
<span class="image-link">
<span
style="margin: 0 0 20px 0; display: inline-block; vertical-align: middle; width: 100%;"
>
<a
target="_blank"
href="https://pikwizard.com/photo/futuristic-stock-market-chart-and-data-interface/e4e1a6009bc5177d5467e788fc3ce6dd/"
style="text-decoration: none; font-size: 10px; margin: 0;"
>
<img src="https://pikwizard.com/pw/medium/e4e1a6009bc5177d5467e788fc3ce6dd.jpg" style="margin: 0; width: 100%;" alt="" />
<p style="font-size: 12px; margin: 0;">PikWizard</p>
</a>
</span>
</span>
Free (free of charge)
Free for personal and commercial use.
Author: Authentic Images
Similar Free Stock Images

Premium


Premium

Premium


Premium


Premium


Premium

Premium


Premium


Premium

Premium

Premium


Premium


Premium


Premium

Premium


Premium


Premium


Premium


Premium


Premium

Premium


Premium


Premium


Premium


Premium


Explore More Free Stock Images