- Home >
- Stock Photos >
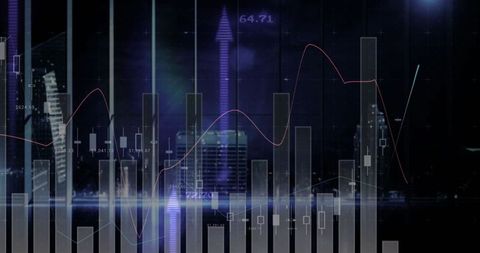
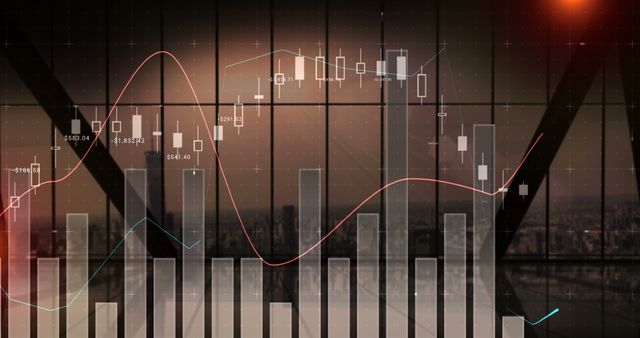
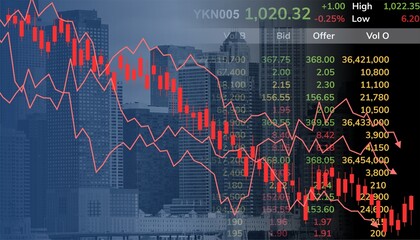
- Futuristic stock market dashboard overlaying urban skyline with candlestick and bar charts
Futuristic stock market dashboard overlaying urban skyline with candlestick and bar charts Image

Overlaying night skyline with translucent candlestick chart, histogram bars, and pink and blue moving average lines, creating dynamic market visualization. Featuring neon gridlines, subtle numeric labels, and reflective glow for high-tech atmosphere. Serving financial websites, trading platform interfaces, investor presentations, market trend reports, and fintech marketing campaigns. Working well as hero background, slide header, blog banner, social media ad, or editorial illustration for business technology content. Allowing easy color matching and layer blending for branded layouts and dark-themed designs.
Powered by 


0
downloads
downloads
Tags:
More
Credit Photo
If you would like to credit the Photo, here are some ways you can do so
Text Link
photo Link
<span class="text-link">
<span>
<a target="_blank" href=https://pikwizard.com/photo/futuristic-stock-market-dashboard-overlaying-urban-skyline-with-candlestick-and-bar-charts/6df6ada8025713085b3fb3c6080f347a/>PikWizard</a>
</span>
</span>
<span class="image-link">
<span
style="margin: 0 0 20px 0; display: inline-block; vertical-align: middle; width: 100%;"
>
<a
target="_blank"
href="https://pikwizard.com/photo/futuristic-stock-market-dashboard-overlaying-urban-skyline-with-candlestick-and-bar-charts/6df6ada8025713085b3fb3c6080f347a/"
style="text-decoration: none; font-size: 10px; margin: 0;"
>
<img src="https://pikwizard.com/pw/medium/6df6ada8025713085b3fb3c6080f347a.jpg" style="margin: 0; width: 100%;" alt="" />
<p style="font-size: 12px; margin: 0;">PikWizard</p>
</a>
</span>
</span>
Free (free of charge)
Free for personal and commercial use.
Author: Awesome Content
Similar Free Stock Images

Premium


Premium


Premium


Premium


Premium


Premium


Premium


Premium


Premium


Premium


Premium


Premium


Premium


Premium


Premium


Premium


Premium


Premium


Premium


Premium


Premium


Premium


Premium


Premium


Premium