- Home >
- Stock Photos >
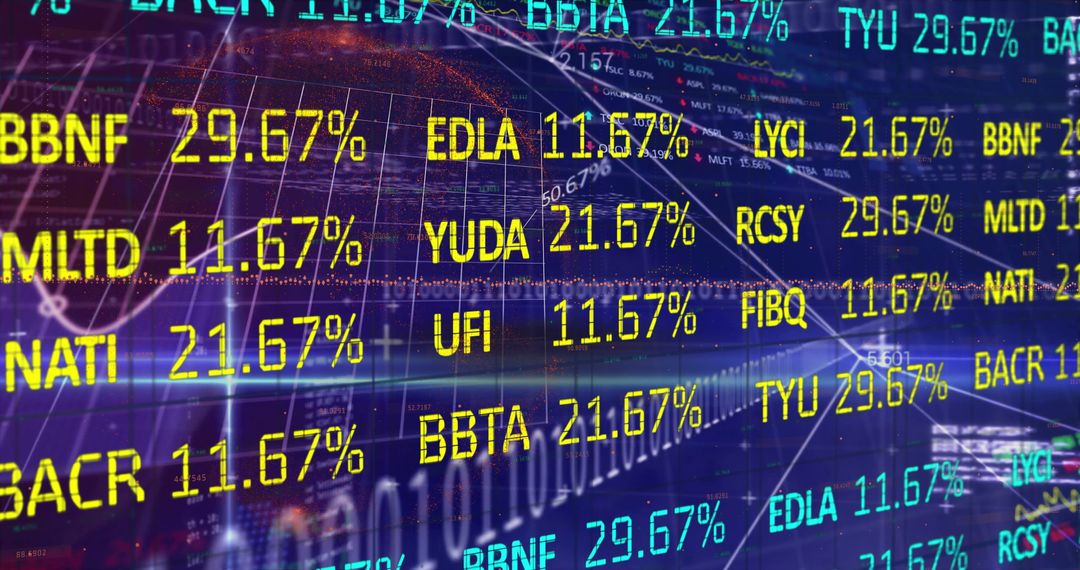
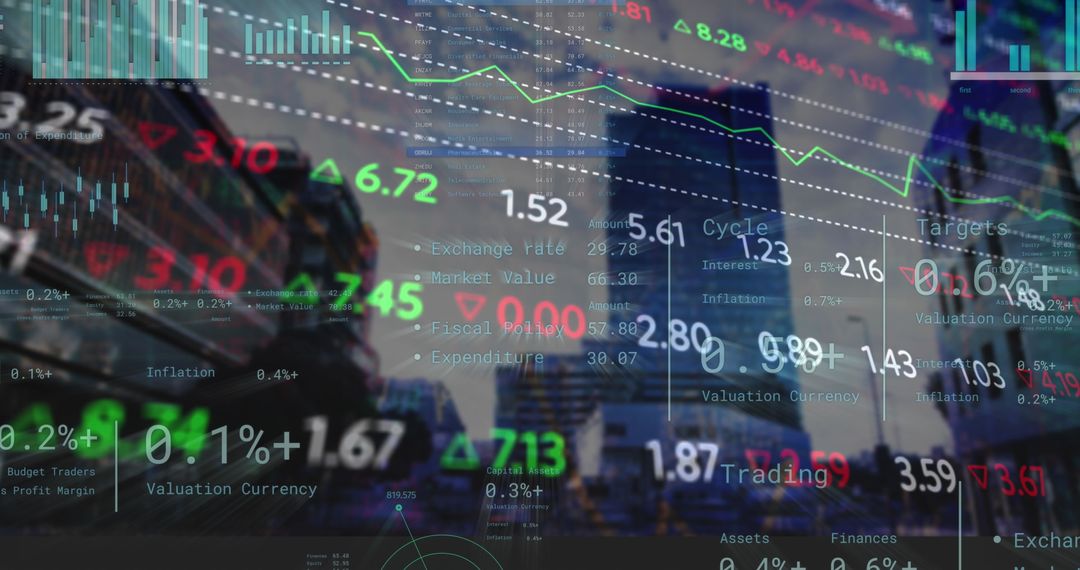
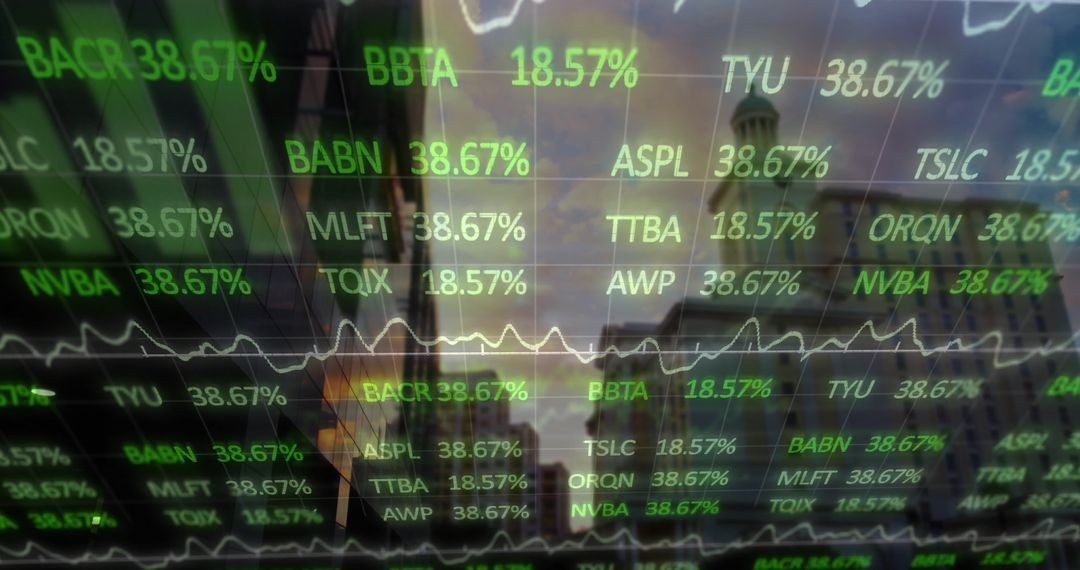
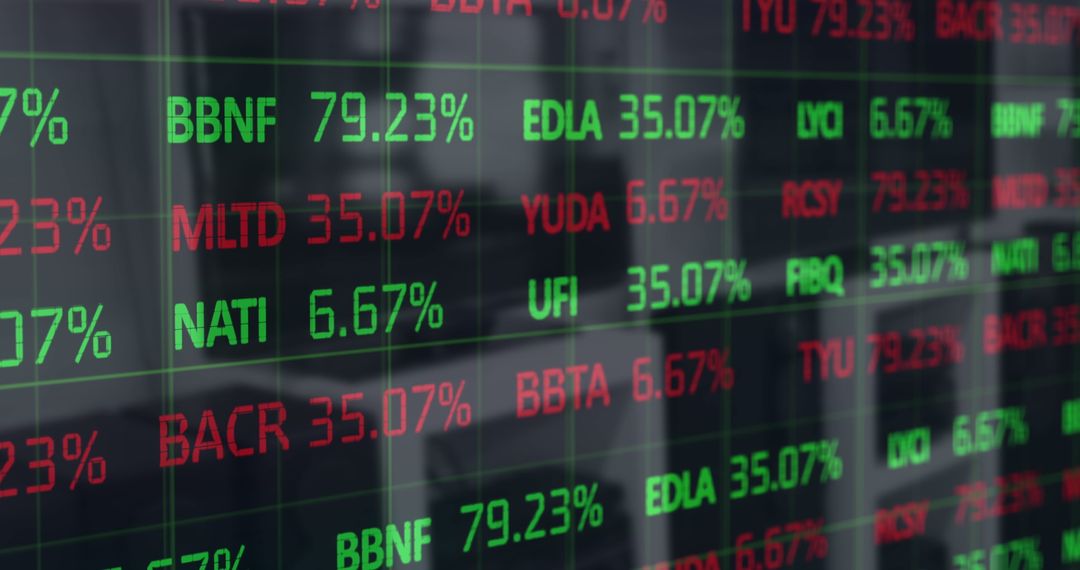
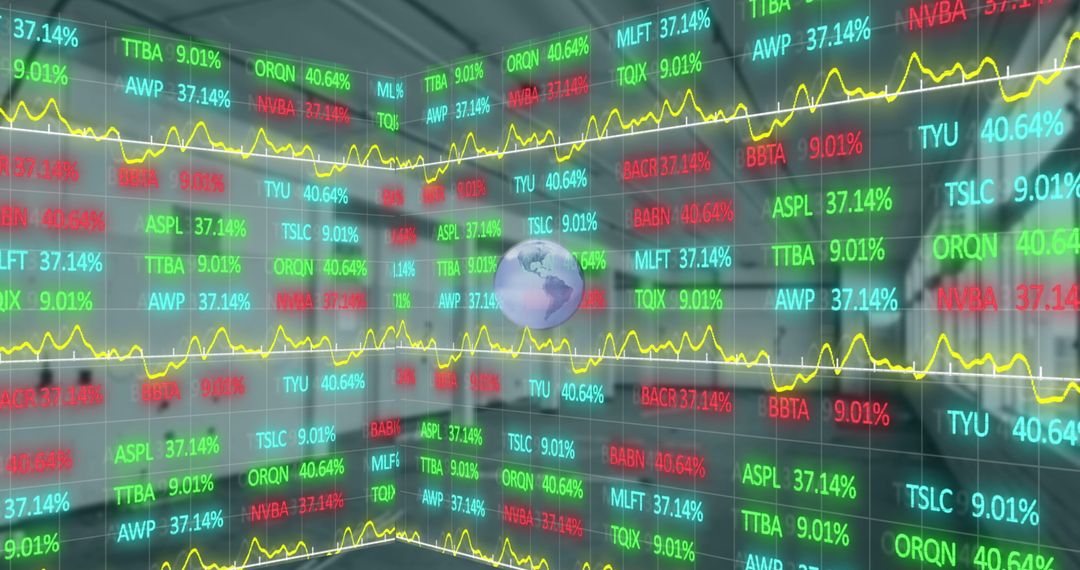
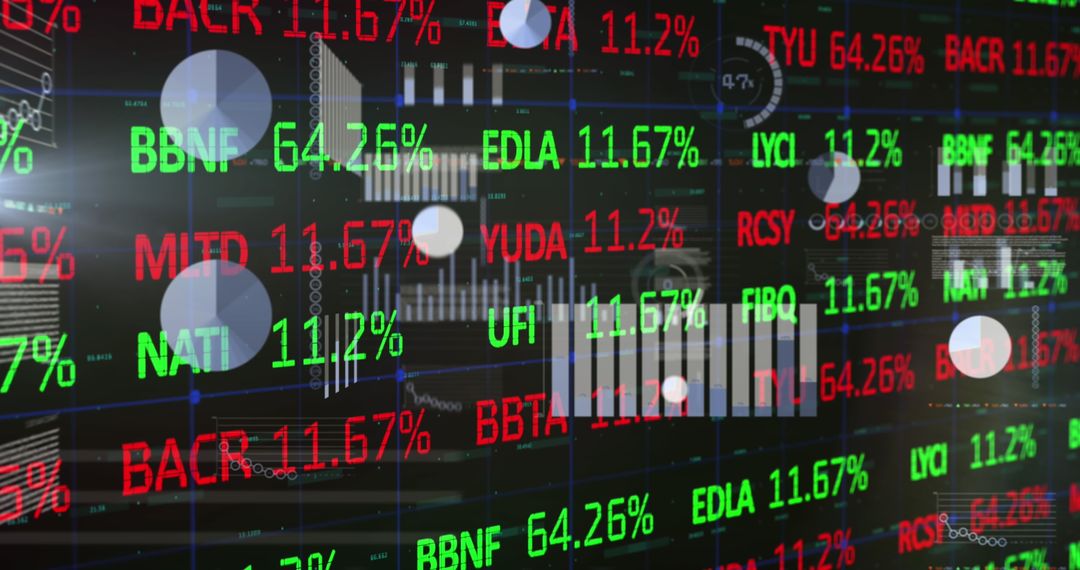
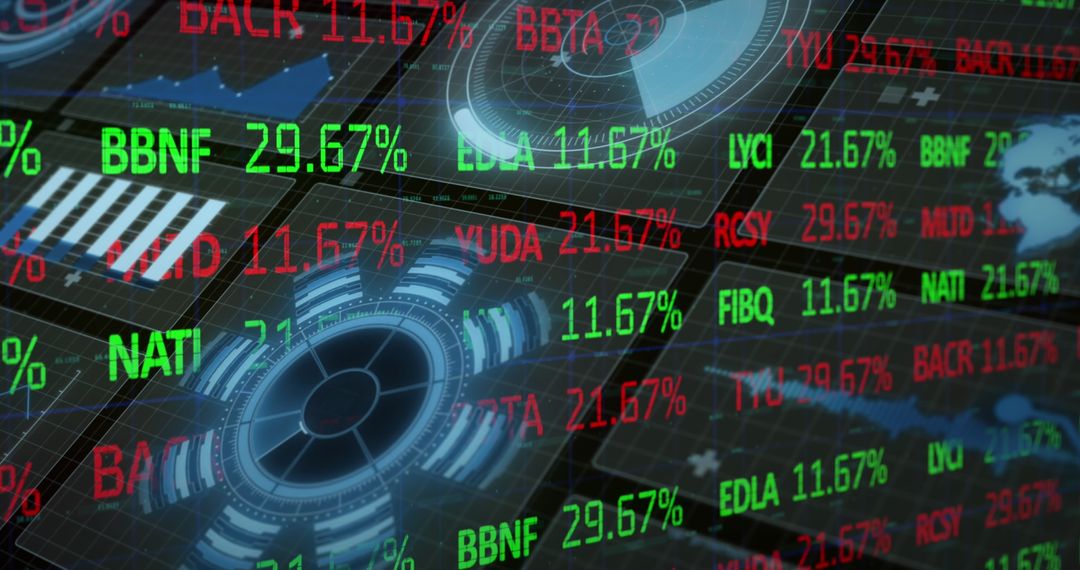
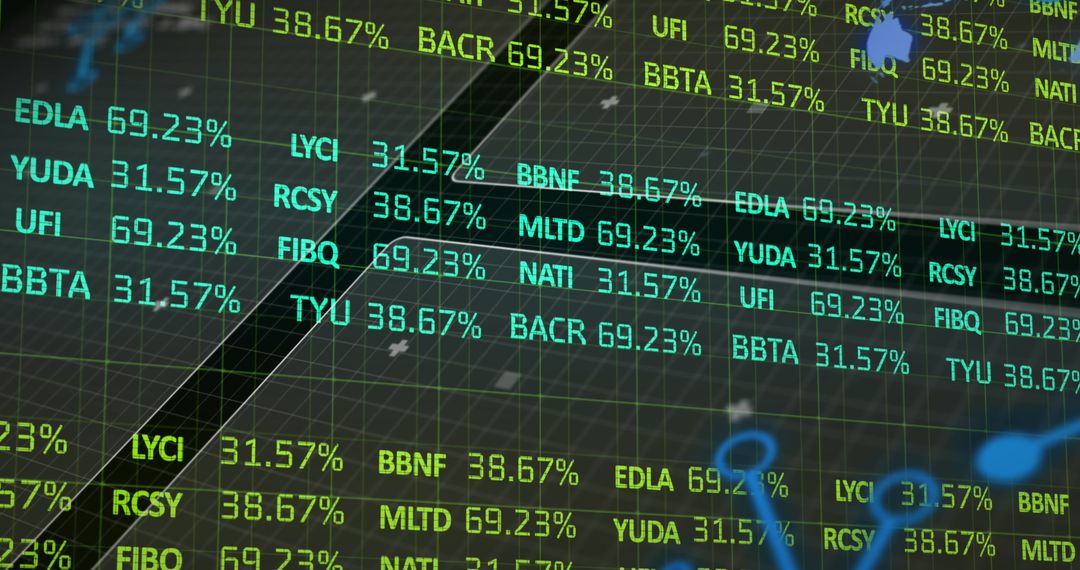
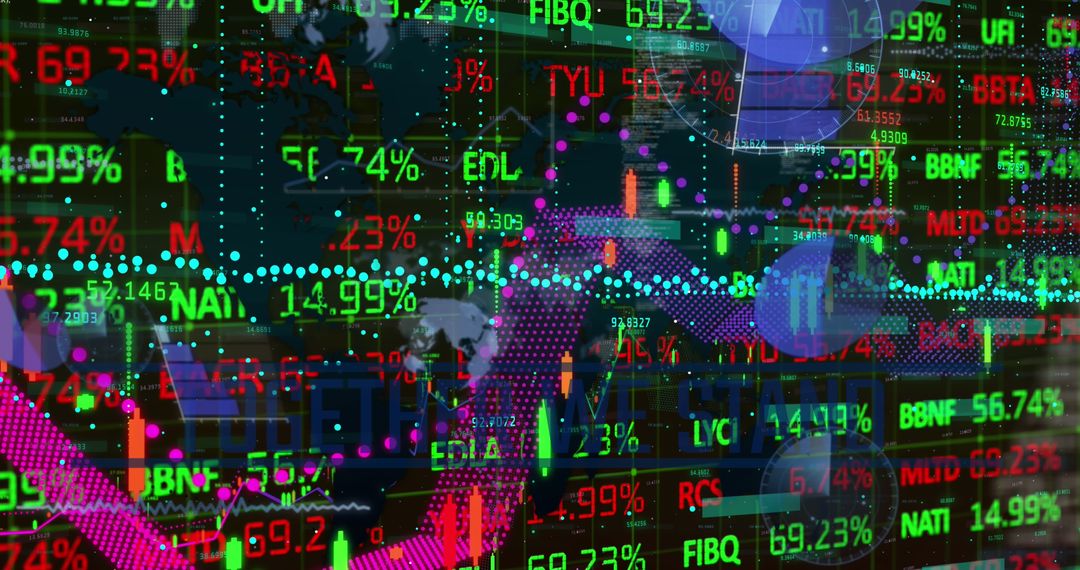
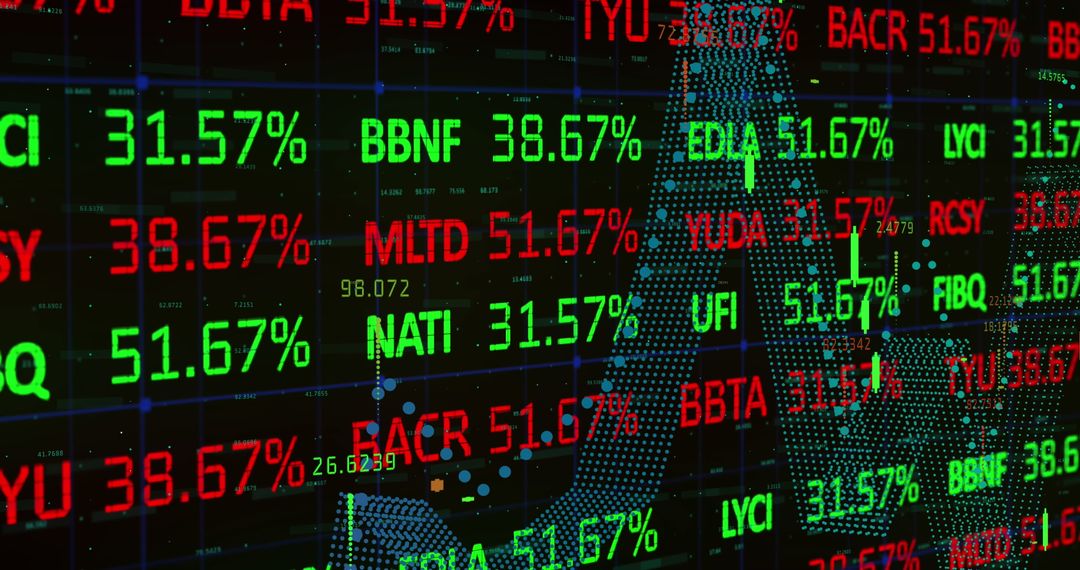
- Futuristic Stock Market Dashboard with Interactive Chart Visualization
Futuristic Stock Market Dashboard with Interactive Chart Visualization Image

Display represents vibrant themes of finance and analytics, perfect for illustrating articles about the stock market. Useful for financial journalism, trading blogs, or educational materials about modern trading technologies. Highlights futuristic options with a focus on holographic data presentation and real-time analytics.
Powered by 


6
downloads
downloads
Tags:
More
Credit Photo
If you would like to credit the Photo, here are some ways you can do so
Text Link
photo Link
<span class="text-link">
<span>
<a target="_blank" href=https://pikwizard.com/photo/futuristic-stock-market-dashboard-with-interactive-chart-visualization/c78bafb51f27836a3c7a68c3460560b7/>PikWizard</a>
</span>
</span>
<span class="image-link">
<span
style="margin: 0 0 20px 0; display: inline-block; vertical-align: middle; width: 100%;"
>
<a
target="_blank"
href="https://pikwizard.com/photo/futuristic-stock-market-dashboard-with-interactive-chart-visualization/c78bafb51f27836a3c7a68c3460560b7/"
style="text-decoration: none; font-size: 10px; margin: 0;"
>
<img src="https://pikwizard.com/pw/medium/c78bafb51f27836a3c7a68c3460560b7.jpg" style="margin: 0; width: 100%;" alt="" />
<p style="font-size: 12px; margin: 0;">PikWizard</p>
</a>
</span>
</span>
Free (free of charge)
Free for personal and commercial use.
Author: Authentic Images
Similar Free Stock Images

Premium


Premium


Premium


Premium


Premium


Premium


Premium


Premium


Premium


Premium


Premium


Premium


Premium


Premium


Premium


Premium


Premium

Premium


Premium


Premium


Premium


Premium


Premium

Premium