
- Home >
- Stock Photos >
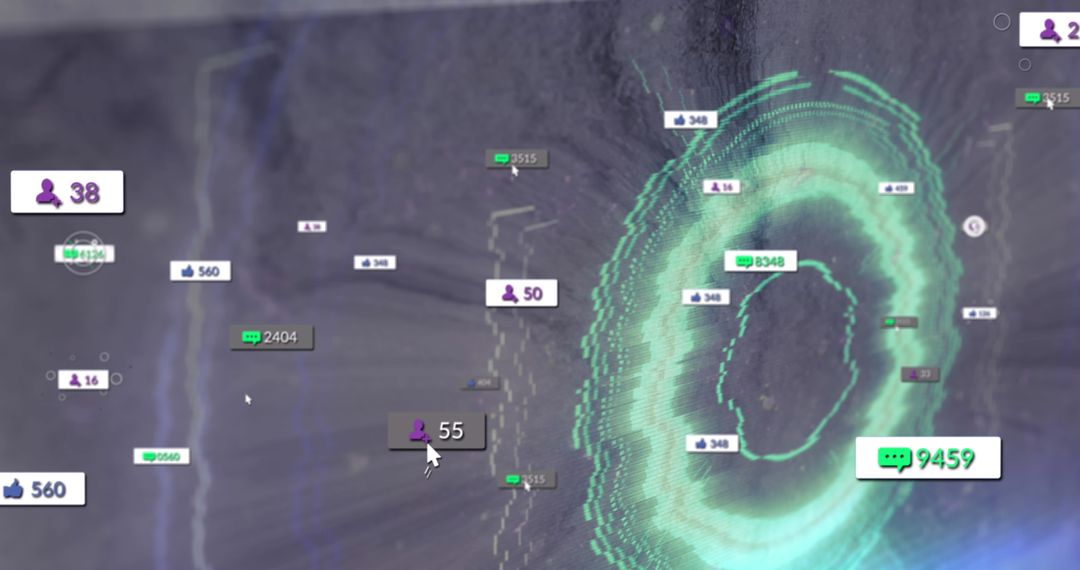
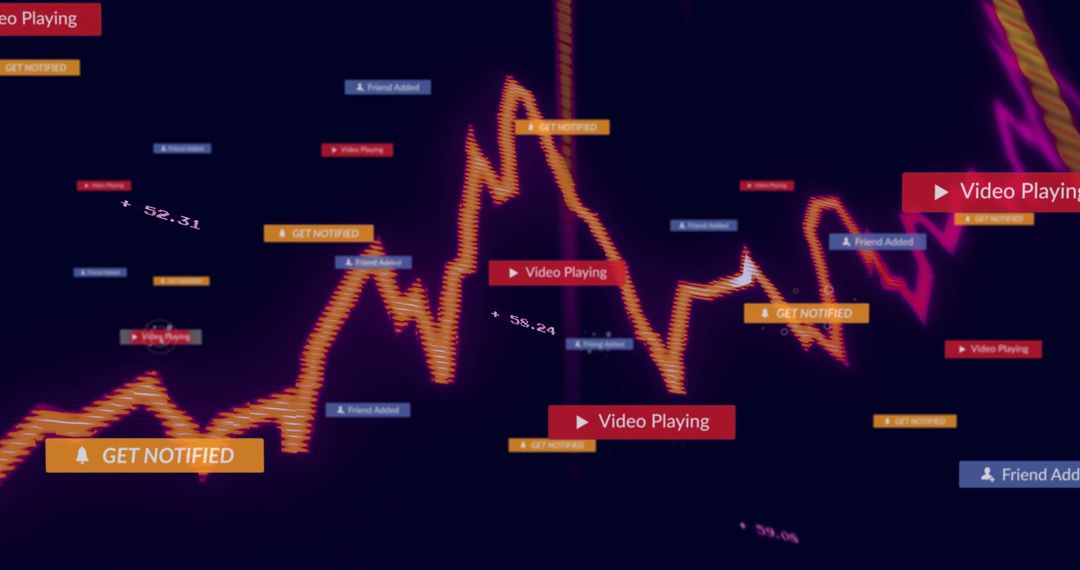
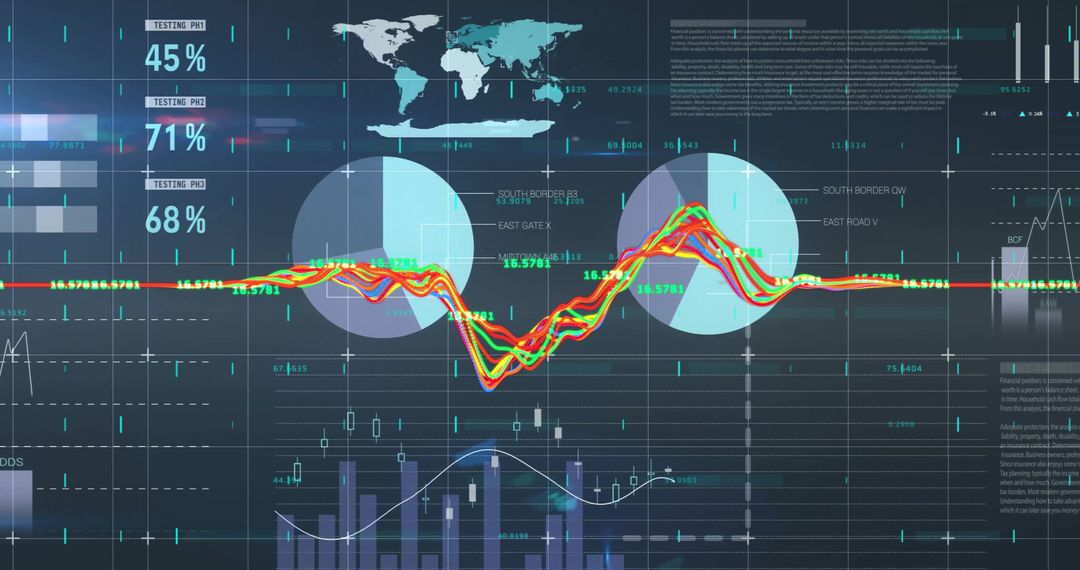
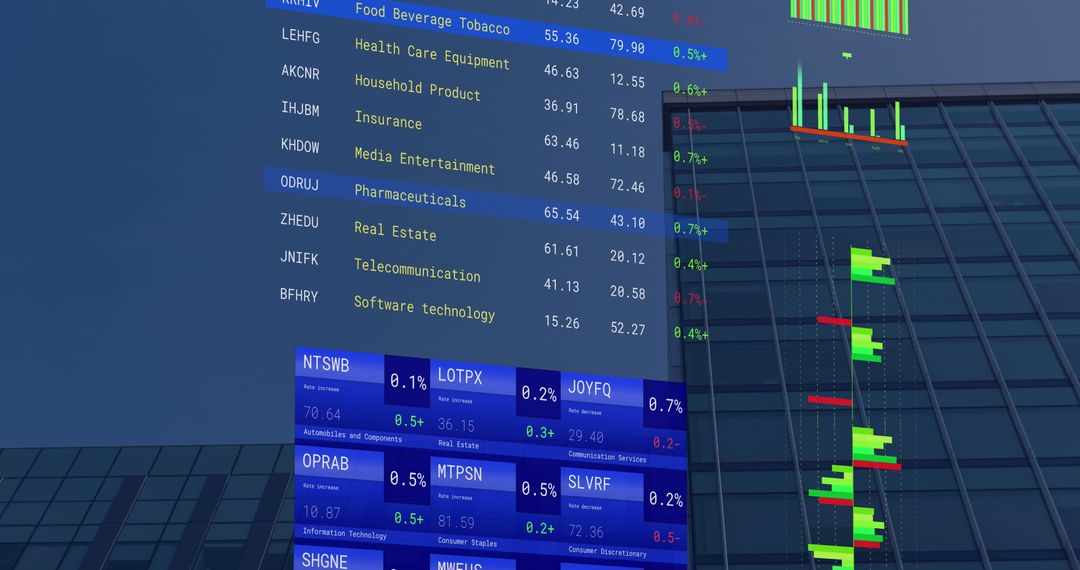
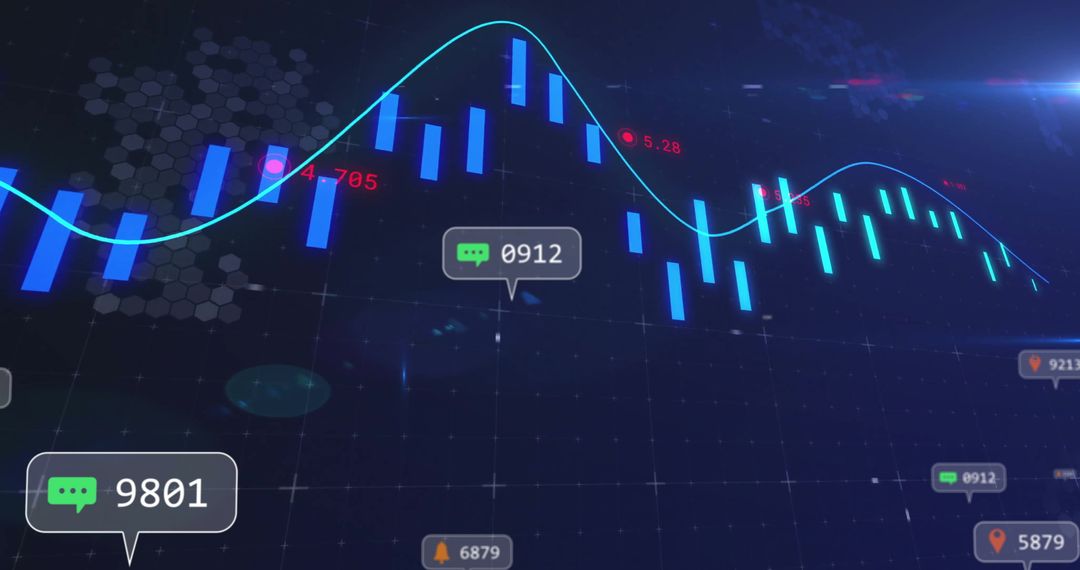
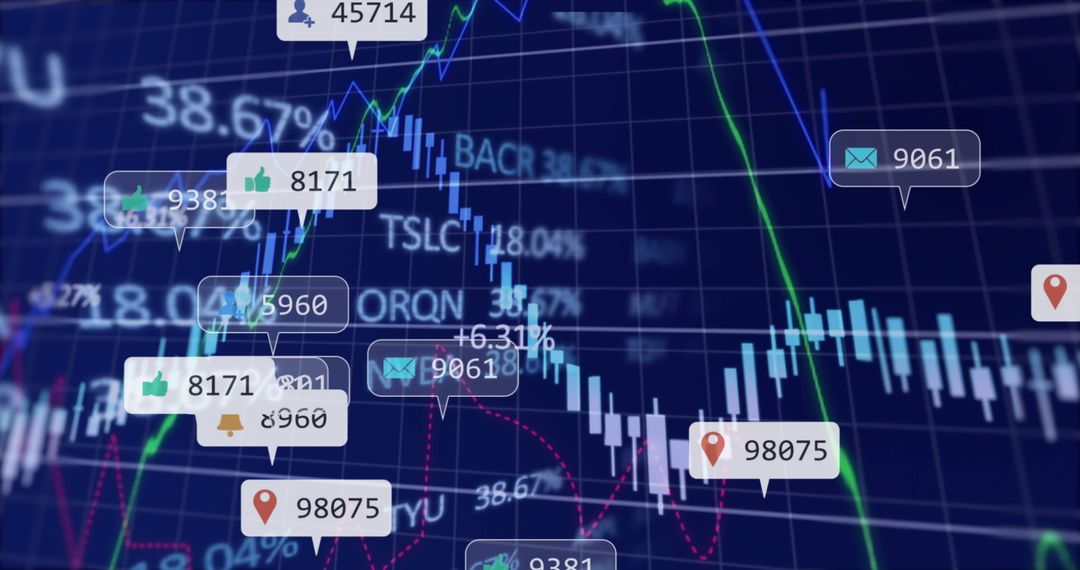
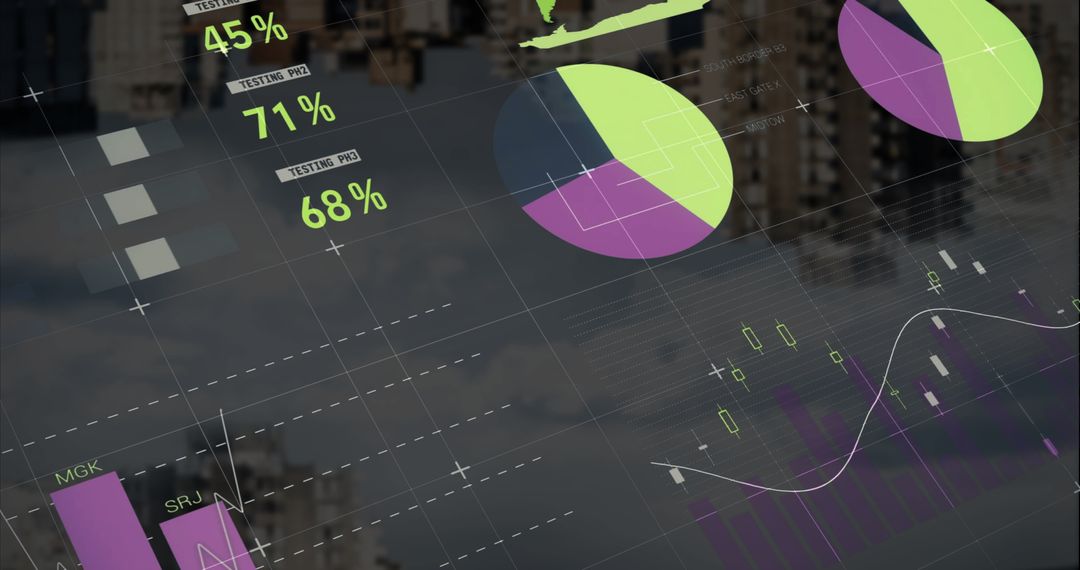
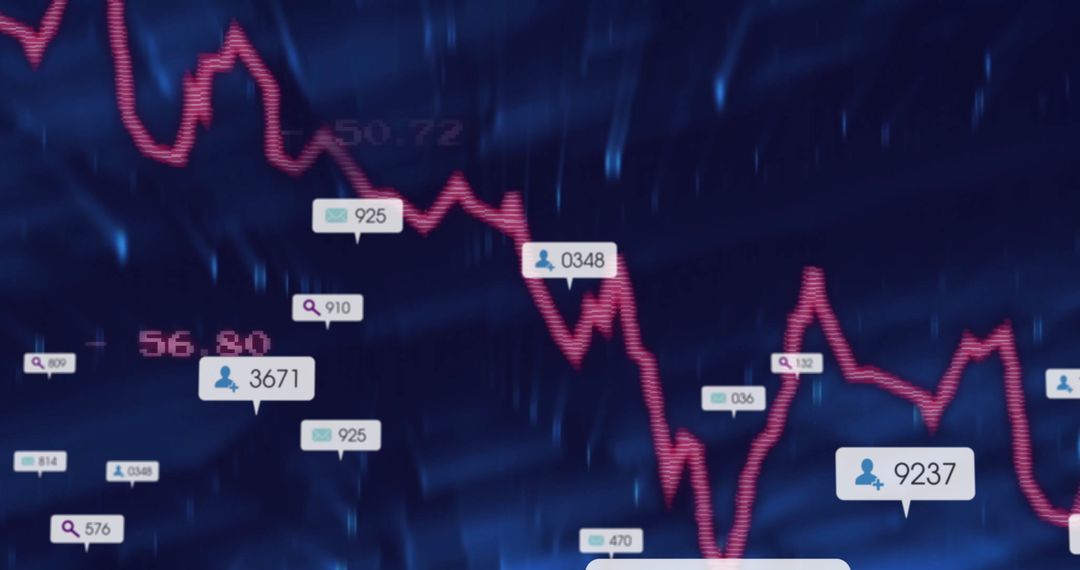
- Futuristic Stock Market Dashboard with Neon Line Graph
Futuristic Stock Market Dashboard with Neon Line Graph Image
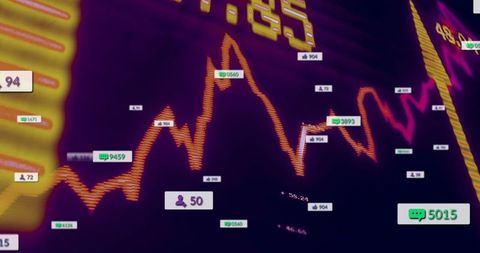
Mesmerizing visualization of stock market trends showing fluctuating neon lines and data inputs on modern digital trading dashboard. Ideal for illustrations of market analytics, financial technology concepts, stock trading strategies, and futuristic investments in finance magazines or tech-focused publications.
Powered by 


0
downloads
downloads
Tags:
More
Credit Photo
If you would like to credit the Photo, here are some ways you can do so
Text Link
photo Link
<span class="text-link">
<span>
<a target="_blank" href=https://pikwizard.com/photo/futuristic-stock-market-dashboard-with-neon-line-graph/fe635bd8c874f812970b2e3ff063ebbf/>PikWizard</a>
</span>
</span>
<span class="image-link">
<span
style="margin: 0 0 20px 0; display: inline-block; vertical-align: middle; width: 100%;"
>
<a
target="_blank"
href="https://pikwizard.com/photo/futuristic-stock-market-dashboard-with-neon-line-graph/fe635bd8c874f812970b2e3ff063ebbf/"
style="text-decoration: none; font-size: 10px; margin: 0;"
>
<img src="https://pikwizard.com/pw/medium/fe635bd8c874f812970b2e3ff063ebbf.jpg" style="margin: 0; width: 100%;" alt="" />
<p style="font-size: 12px; margin: 0;">PikWizard</p>
</a>
</span>
</span>
Free (free of charge)
Free for personal and commercial use.
Author: People Creations
Similar Free Stock Images

Premium


Premium


Premium


Premium


Premium


Premium


Premium


Premium


Premium


Premium


Premium


Premium


Premium


Premium


Premium


Premium


Premium


Premium


Premium


Premium


Premium


Premium


Premium


Premium

