- Home >
- Stock Photos >
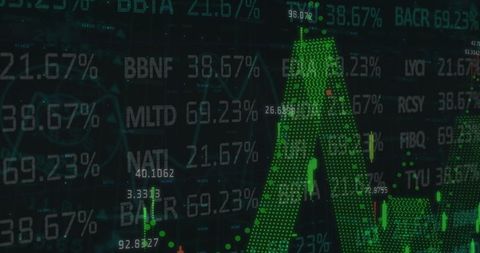
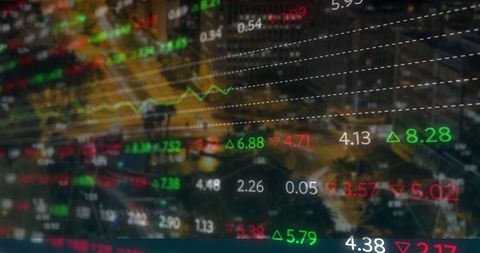
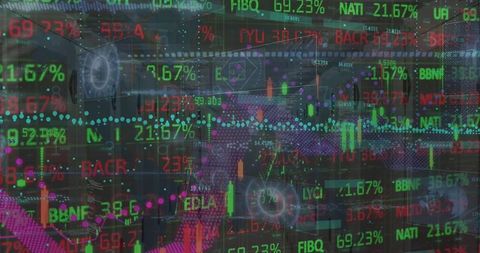
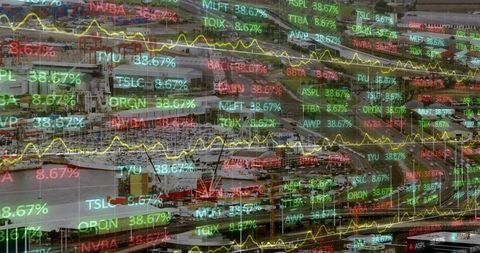
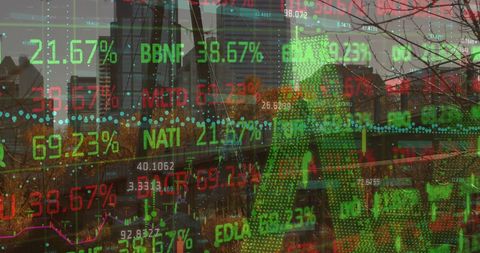
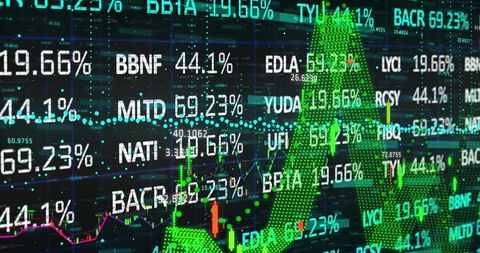
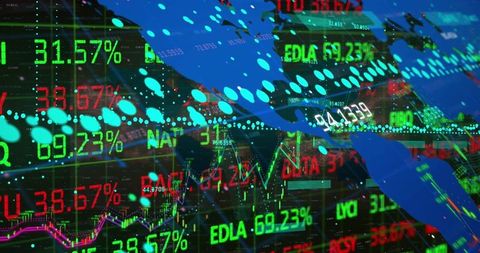
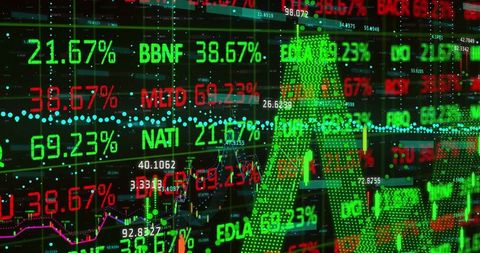
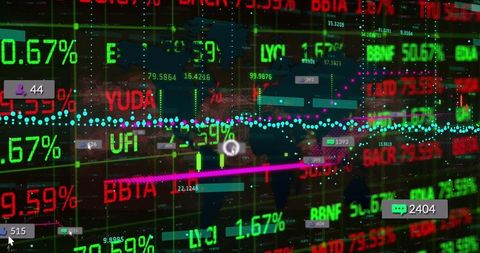
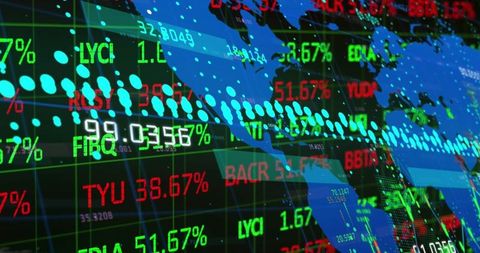
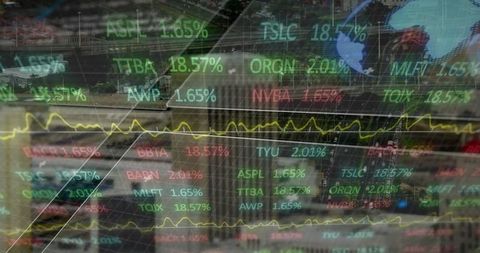
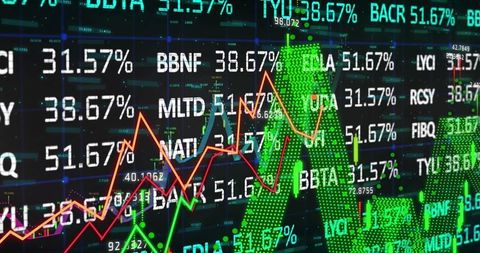
- Futuristic Stock Market Data Overlay Visualization
Futuristic Stock Market Data Overlay Visualization Image

Dynamic display of stock market data with candlestick bars and ticker symbols, merging real-time finance analysis with a colorful graphical interface. Perfect for financial tech presentations, tech finance blogs, innovative data science illustrating market trends, or educational content about stock markets.

downloads
Tags:
More
Credit Photo
If you would like to credit the Photo, here are some ways you can do so
Text Link
photo Link
<span class="text-link">
<span>
<a target="_blank" href=https://pikwizard.com/photo/futuristic-stock-market-data-overlay-visualization/920884c2df081a53ba4b5116014ffd91/>PikWizard</a>
</span>
</span>
<span class="image-link">
<span
style="margin: 0 0 20px 0; display: inline-block; vertical-align: middle; width: 100%;"
>
<a
target="_blank"
href="https://pikwizard.com/photo/futuristic-stock-market-data-overlay-visualization/920884c2df081a53ba4b5116014ffd91/"
style="text-decoration: none; font-size: 10px; margin: 0;"
>
<img src="https://pikwizard.com/pw/medium/920884c2df081a53ba4b5116014ffd91.jpg" style="margin: 0; width: 100%;" alt="" />
<p style="font-size: 12px; margin: 0;">PikWizard</p>
</a>
</span>
</span>
Free (free of charge)
Free for personal and commercial use.
Author: Awesome Content