
- Home >
- Stock Photos >
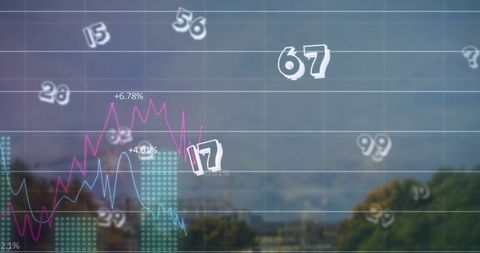
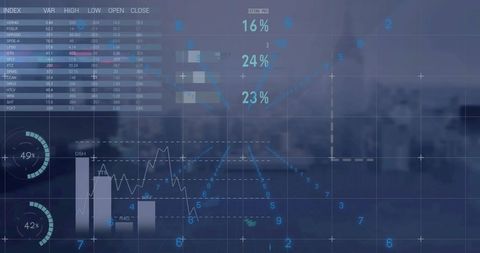
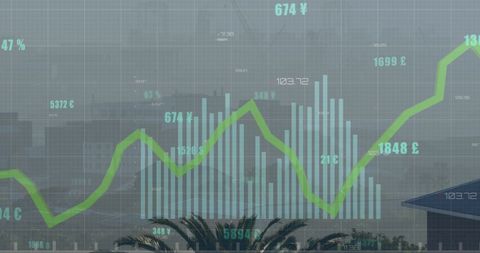
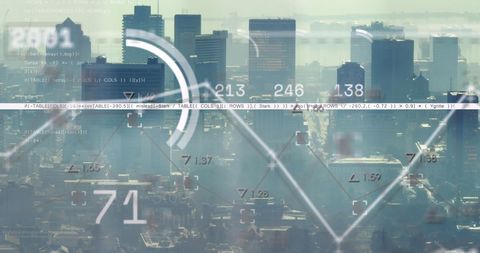
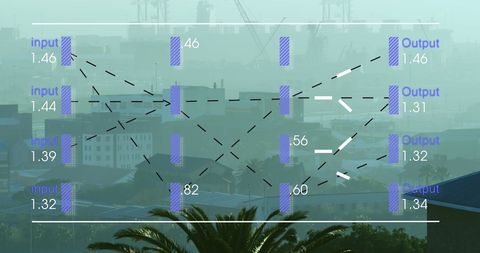
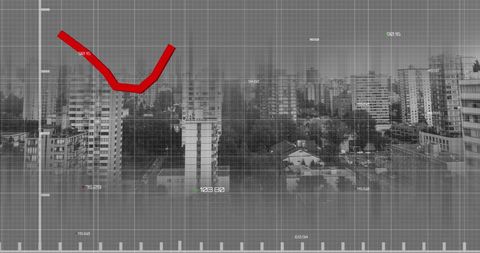
- Futuristic Stock Market Data Processing with Glitch Effect
Futuristic Stock Market Data Processing with Glitch Effect Image

Illustrates intersection of finance and tech by overlaying glitch effect on stock market data with city background. Perfect for conveying advanced economy themes in presentations or articles related to financial analytics, global economy, or technology impacts in urban settings.
Powered by 


downloads
Tags:
More
Credit Photo
If you would like to credit the Photo, here are some ways you can do so
Text Link
photo Link
<span class="text-link">
<span>
<a target="_blank" href=https://pikwizard.com/photo/futuristic-stock-market-data-processing-with-glitch-effect/0df7e5b9773ea4be56b74148f587ef7f/>PikWizard</a>
</span>
</span>
<span class="image-link">
<span
style="margin: 0 0 20px 0; display: inline-block; vertical-align: middle; width: 100%;"
>
<a
target="_blank"
href="https://pikwizard.com/photo/futuristic-stock-market-data-processing-with-glitch-effect/0df7e5b9773ea4be56b74148f587ef7f/"
style="text-decoration: none; font-size: 10px; margin: 0;"
>
<img src="https://pikwizard.com/pw/medium/0df7e5b9773ea4be56b74148f587ef7f.jpg" style="margin: 0; width: 100%;" alt="" />
<p style="font-size: 12px; margin: 0;">PikWizard</p>
</a>
</span>
</span>
Free (free of charge)
Free for personal and commercial use.
Author: Creative Art
Similar Free Stock Images
Premium


Premium


Premium


Premium


Premium


Premium


Premium


Premium


Premium


Premium


Premium


Premium


Premium

Premium


Premium


Premium


Premium

Premium


Premium


Premium


Premium


Premium


Premium


Premium


Premium

Explore More Free Stock Images