- Home >
- Stock Photos >
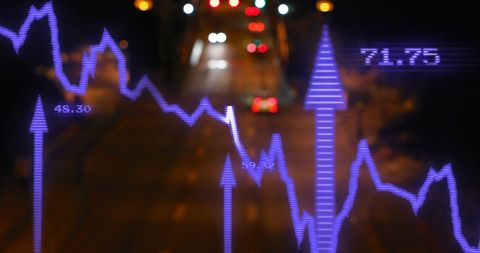
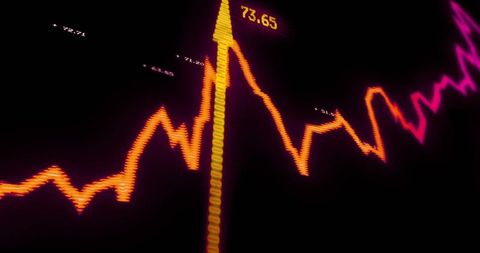
- Futuristic Stock Market Data Visualization with Graphs
Futuristic Stock Market Data Visualization with Graphs Image

Brightly colored graphs and data charts symbolize fluctuating stock market data, providing a visual representation ideal for financial firms or business analysis discussions. Perfect for showcasing advanced analytics and data-driven discussions in publications or websites focused on global finance trends.

downloads
Tags:
More
Credit Photo
If you would like to credit the Photo, here are some ways you can do so
Text Link
photo Link
<span class="text-link">
<span>
<a target="_blank" href=https://pikwizard.com/photo/futuristic-stock-market-data-visualization-with-graphs/050df7ed4935c13fcda1b75e38ad114c/>PikWizard</a>
</span>
</span>
<span class="image-link">
<span
style="margin: 0 0 20px 0; display: inline-block; vertical-align: middle; width: 100%;"
>
<a
target="_blank"
href="https://pikwizard.com/photo/futuristic-stock-market-data-visualization-with-graphs/050df7ed4935c13fcda1b75e38ad114c/"
style="text-decoration: none; font-size: 10px; margin: 0;"
>
<img src="https://pikwizard.com/pw/medium/050df7ed4935c13fcda1b75e38ad114c.jpg" style="margin: 0; width: 100%;" alt="" />
<p style="font-size: 12px; margin: 0;">PikWizard</p>
</a>
</span>
</span>
Free (free of charge)
Free for personal and commercial use.
Author: Authentic Images