
- Home >
- Stock Photos >
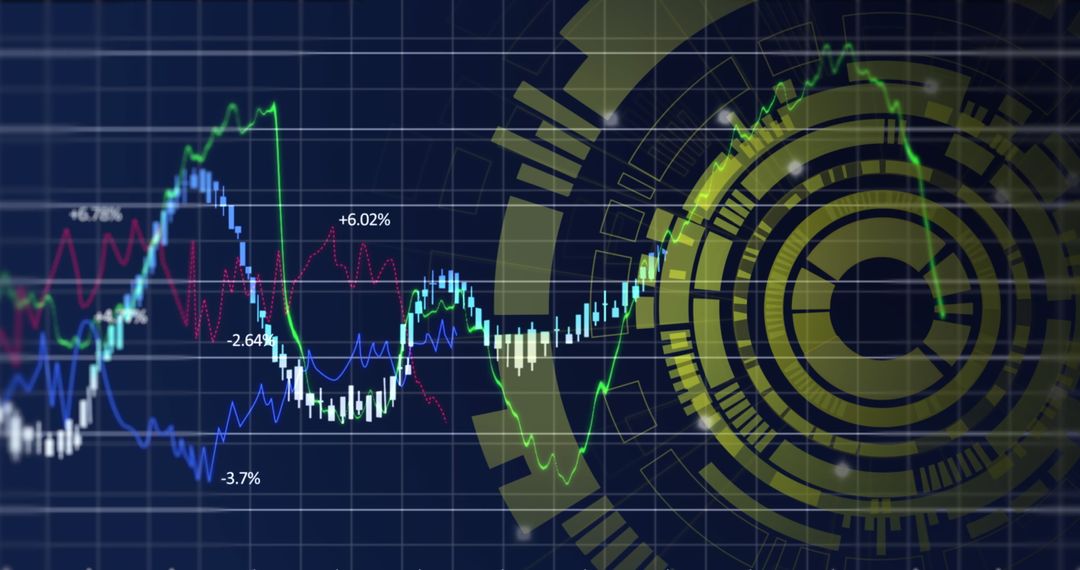
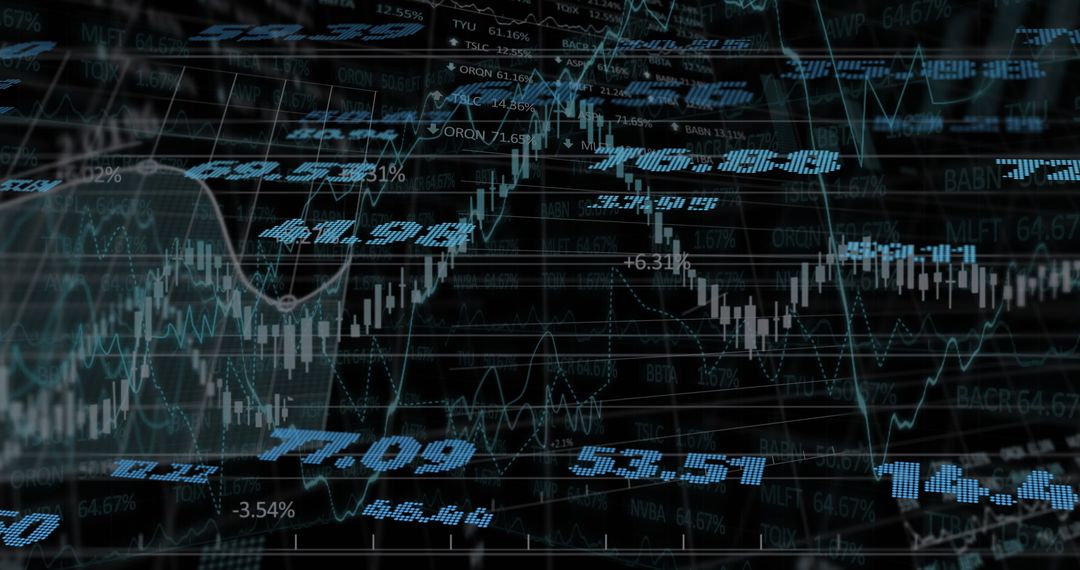
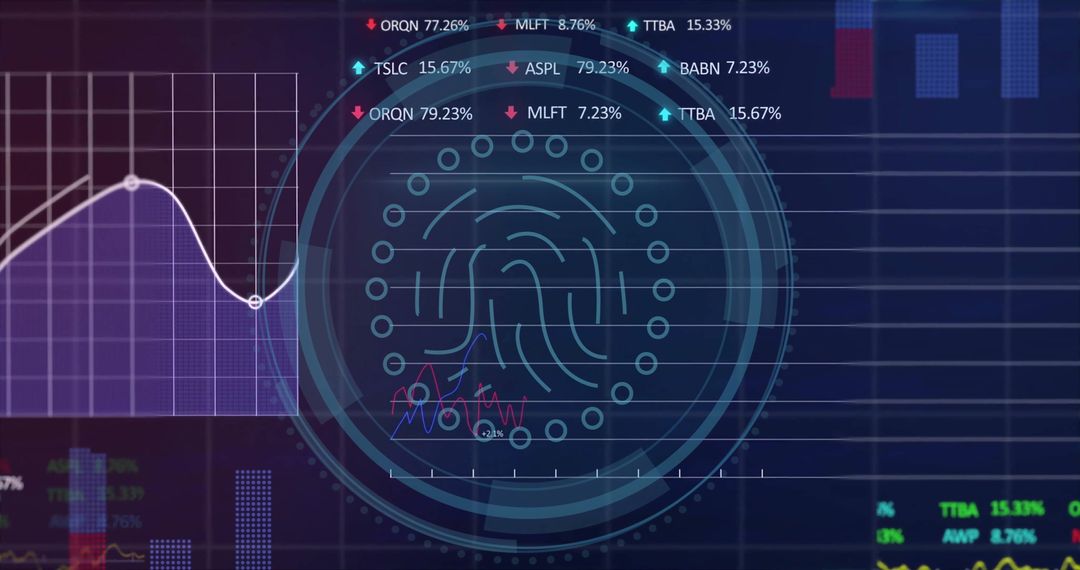
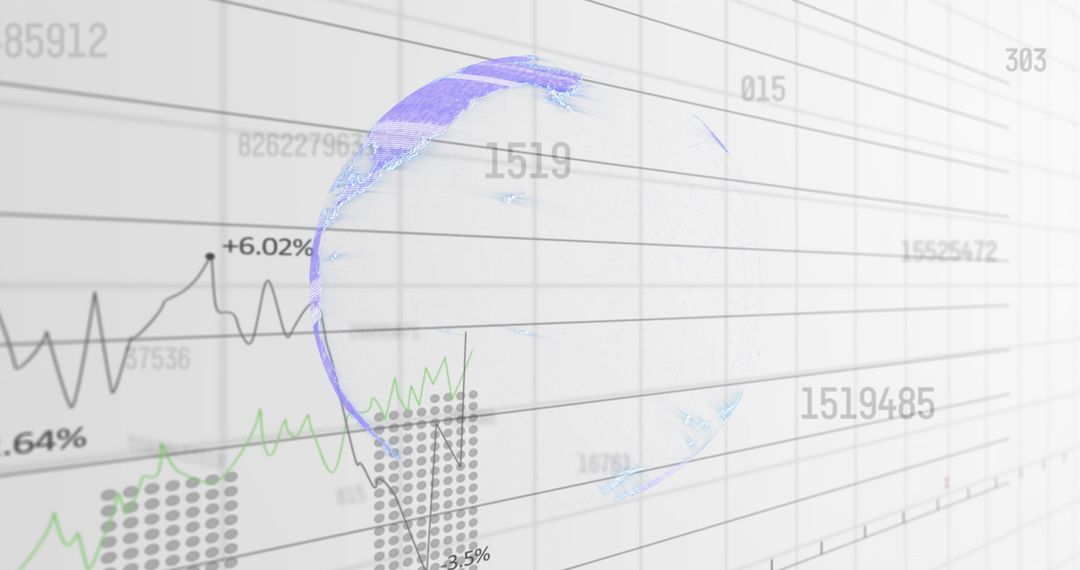
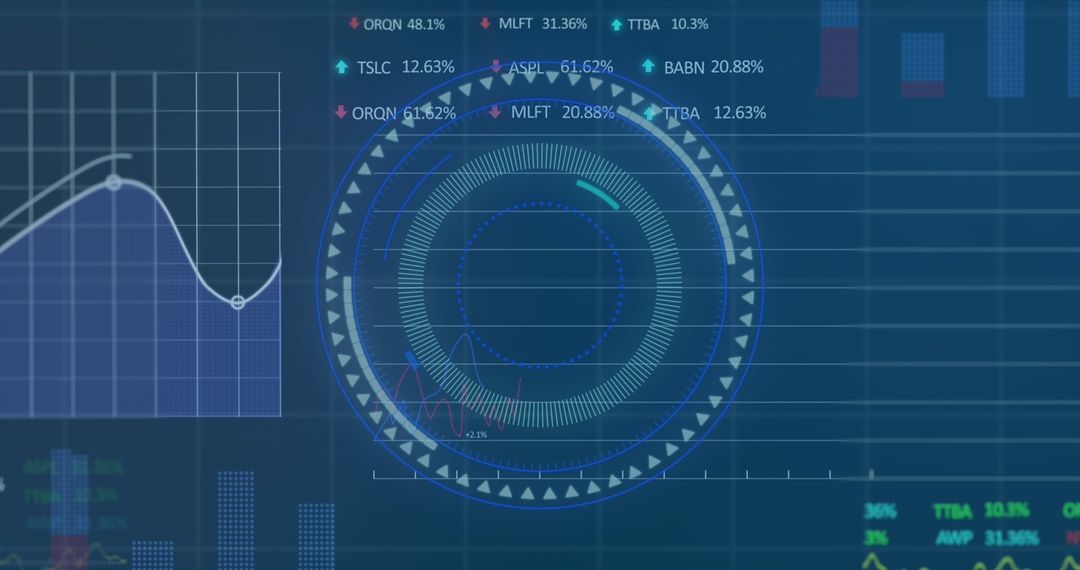
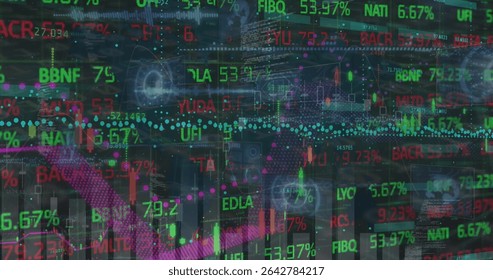
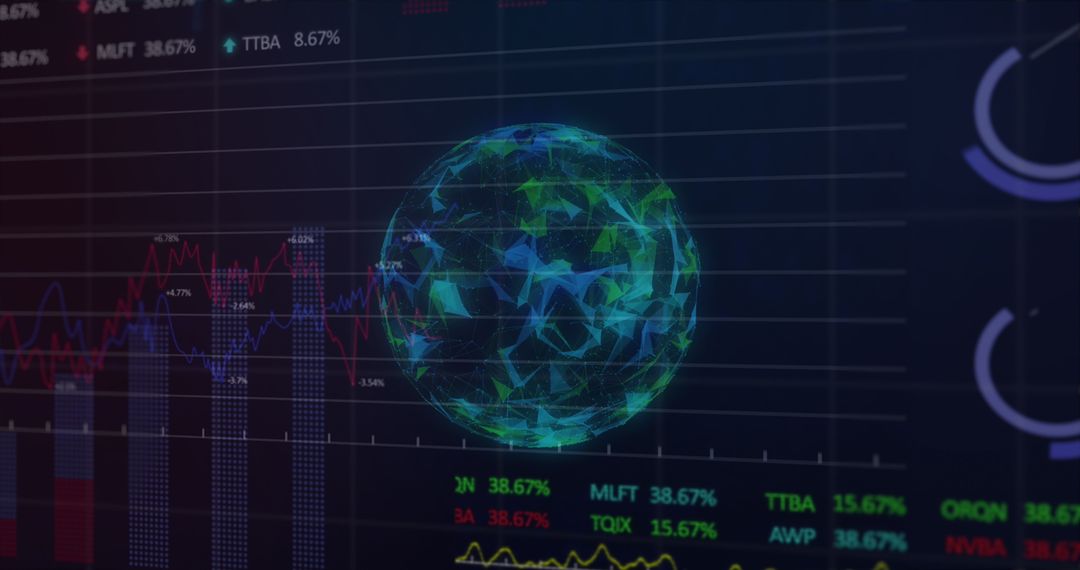
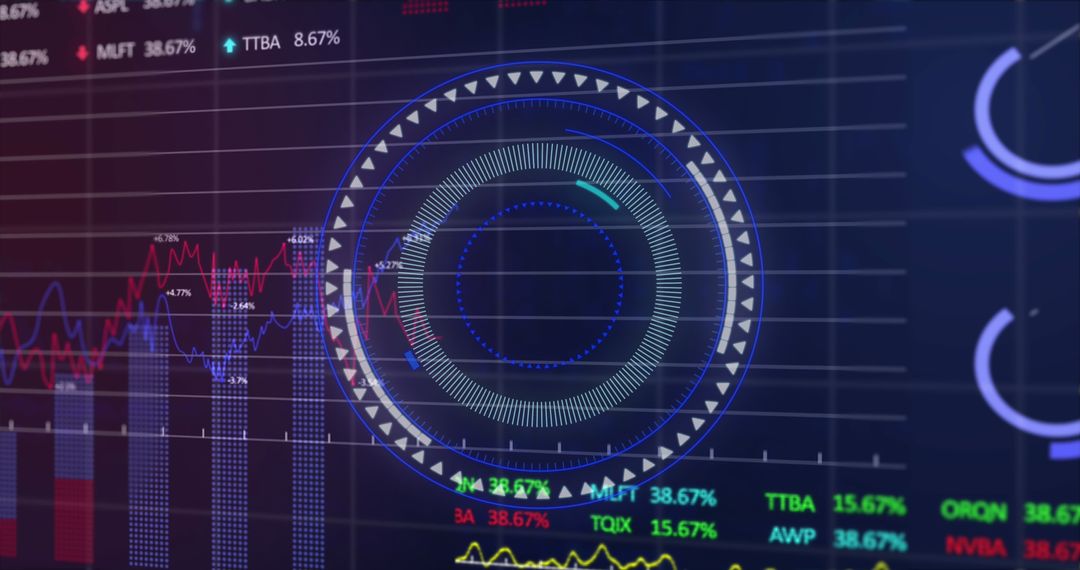
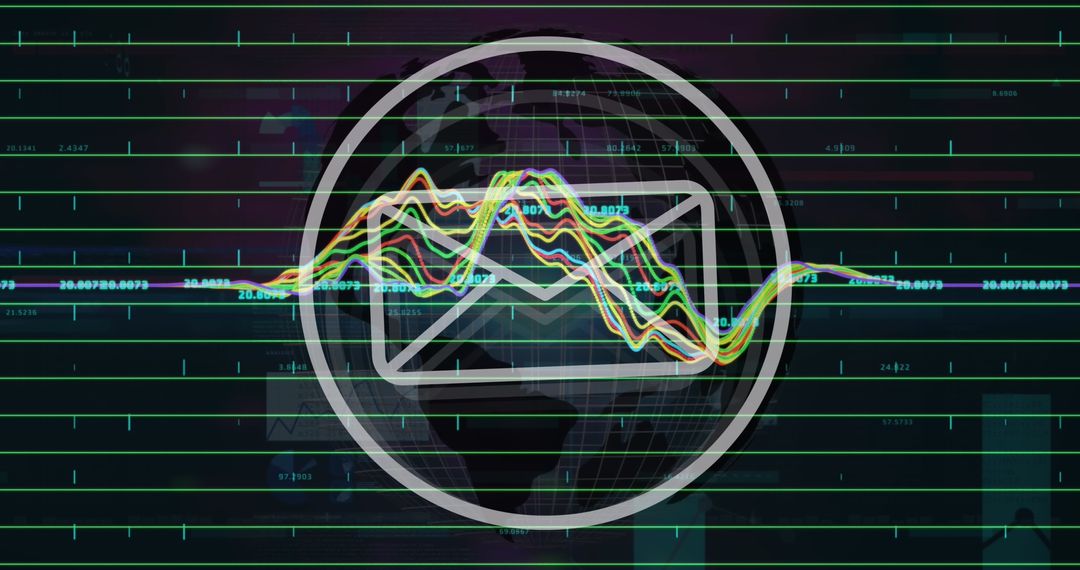
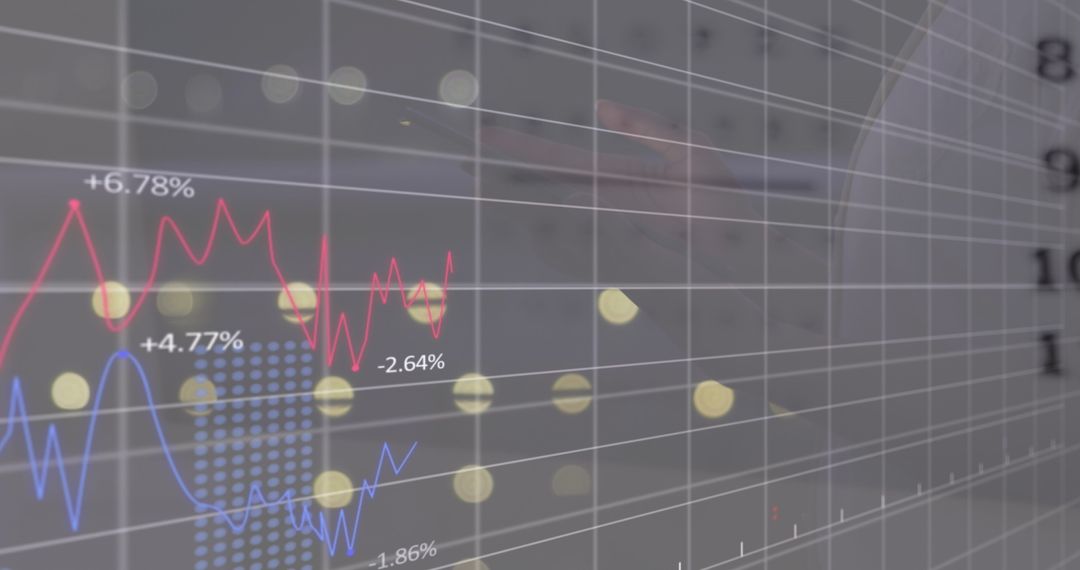
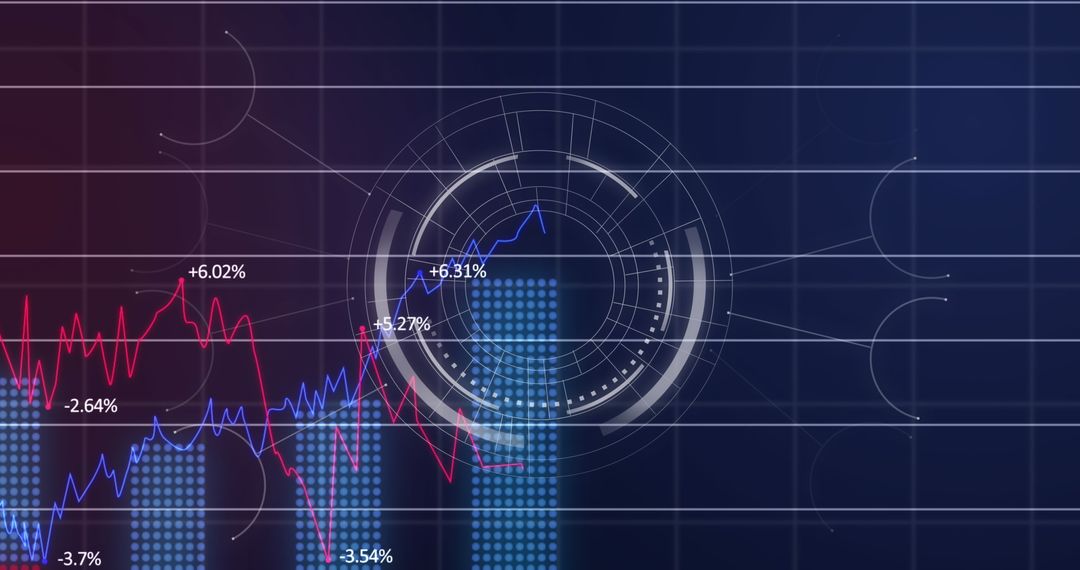
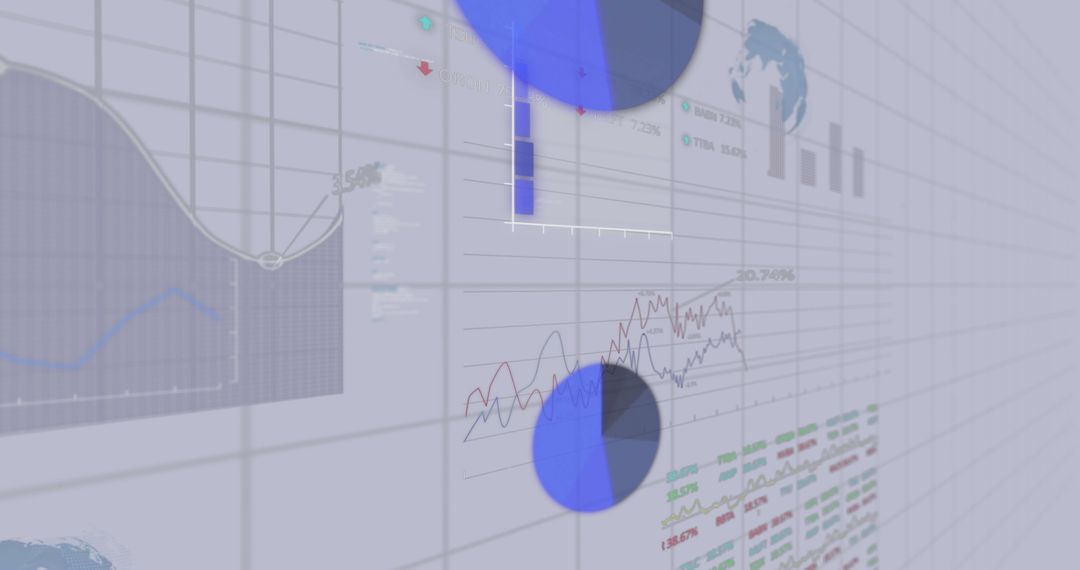
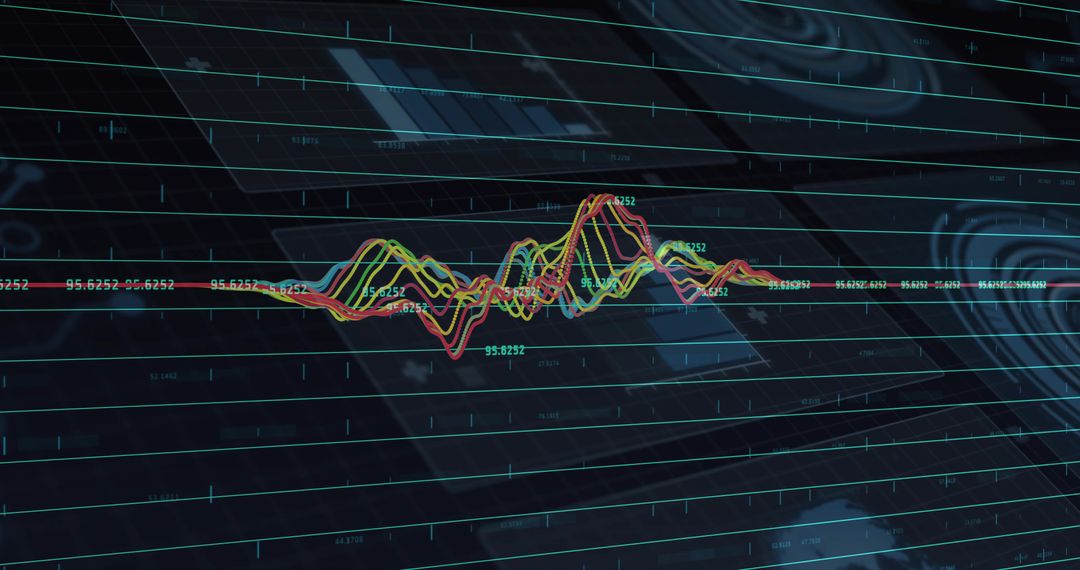
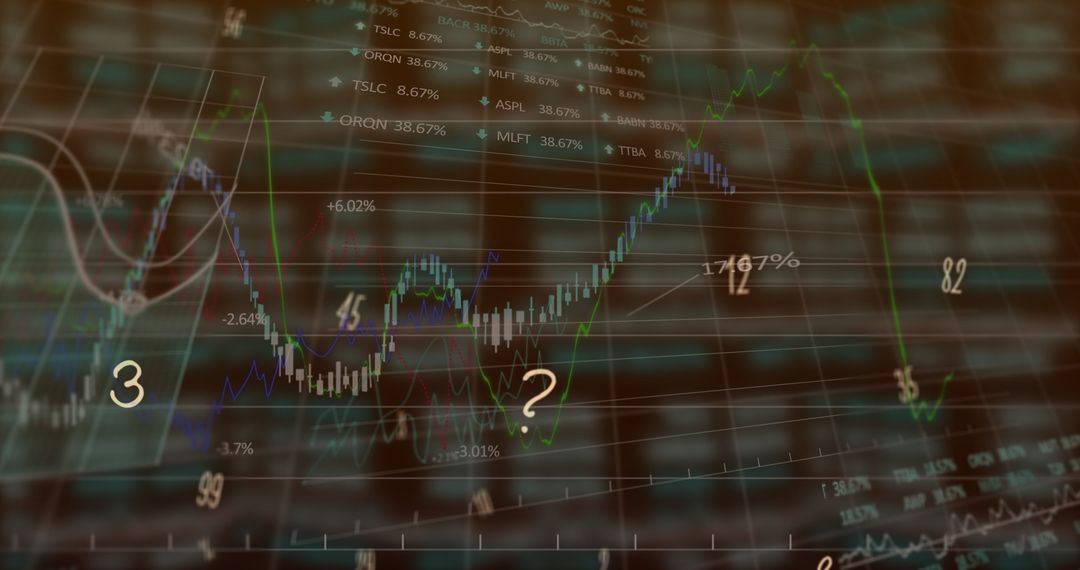
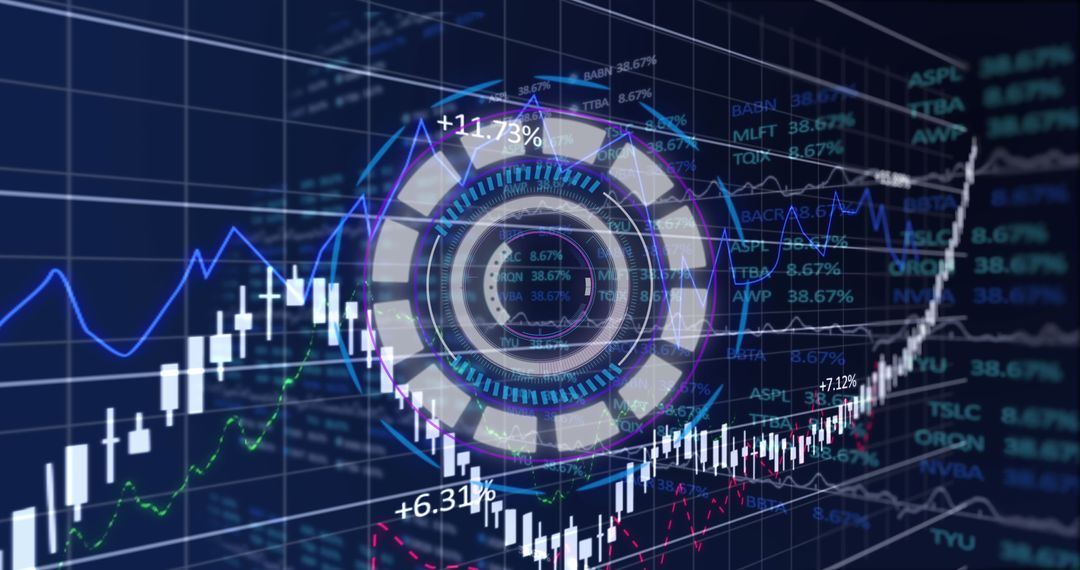
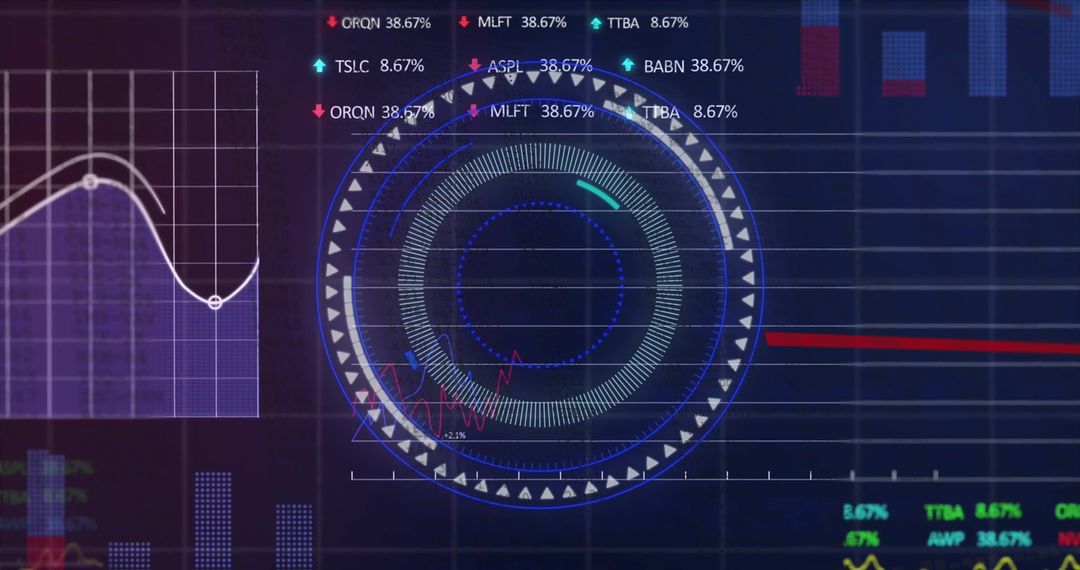
- Futuristic Stock Market Data Visualization with Holographic Display
Futuristic Stock Market Data Visualization with Holographic Display Image

This digital illustration features a holographic display of stock market indicators and graphs against a dark background. Iconic loading circles and trading boards convey themes of technological advancement and business. Useful for articles and materials that focus on finance, analytics, and future innovations in trading technology.
Powered by  - Get 15% off with code: PIKWIZARD15


2
downloads
downloads
Tags:
More
Credit Photo
If you would like to credit the Photo, here are some ways you can do so
Text Link
photo Link
<span class="text-link">
<span>
<a target="_blank" href=https://pikwizard.com/photo/futuristic-stock-market-data-visualization-with-holographic-display/231c3023bb270c44a52b19e6535ff59d/>PikWizard</a>
</span>
</span>
<span class="image-link">
<span
style="margin: 0 0 20px 0; display: inline-block; vertical-align: middle; width: 100%;"
>
<a
target="_blank"
href="https://pikwizard.com/photo/futuristic-stock-market-data-visualization-with-holographic-display/231c3023bb270c44a52b19e6535ff59d/"
style="text-decoration: none; font-size: 10px; margin: 0;"
>
<img src="https://pikwizard.com/pw/medium/231c3023bb270c44a52b19e6535ff59d.jpg" style="margin: 0; width: 100%;" alt="" />
<p style="font-size: 12px; margin: 0;">PikWizard</p>
</a>
</span>
</span>
Free (free of charge)
Free for personal and commercial use.
Author: Creative Art
Similar Free Stock Images

Premium


Premium


Premium


Premium


Premium


Premium


Premium


Premium


Premium


Premium


Premium


Premium


Premium


Premium


Premium


Premium


Premium


Premium


Premium


Premium


Premium


Premium


Premium


Premium

