- Home >
- Stock Photos >
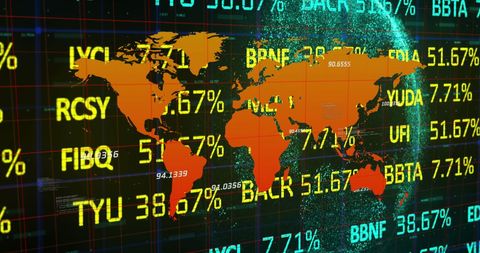
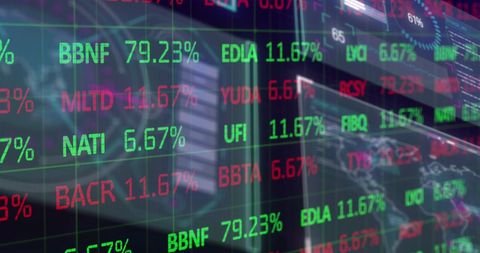
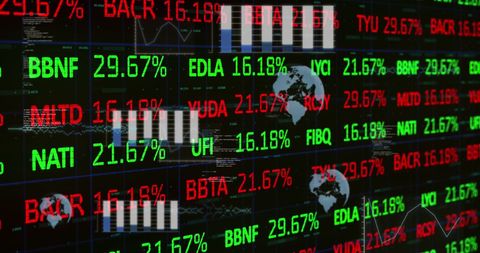
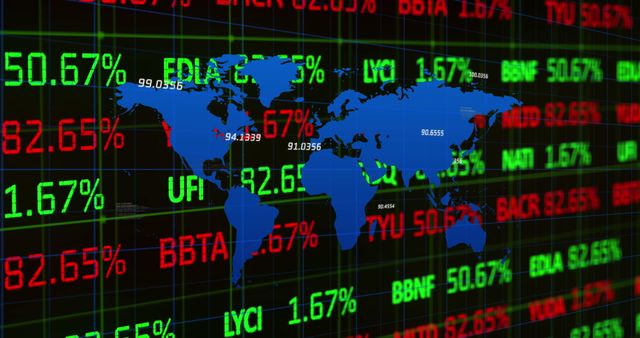
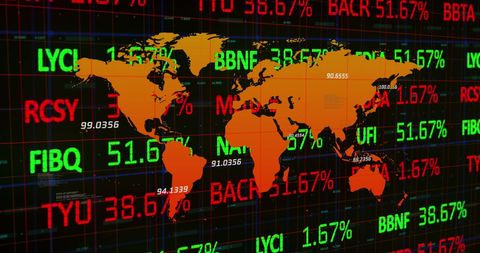
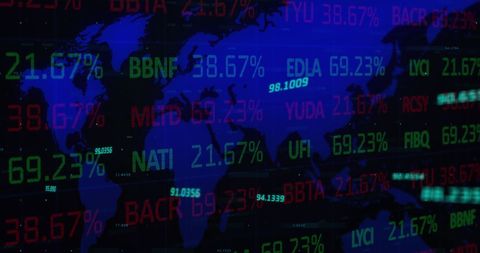
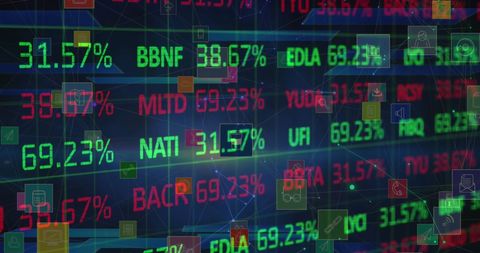
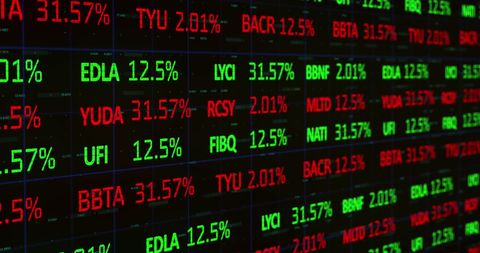
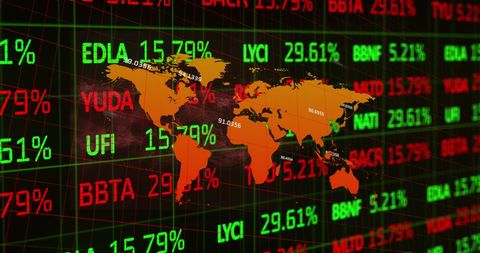
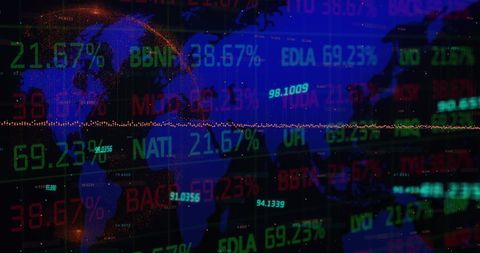
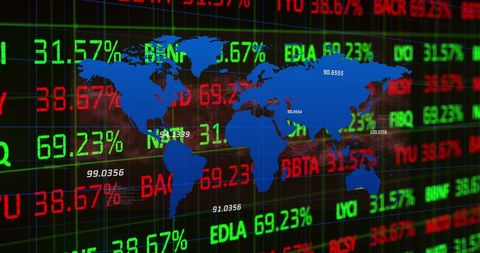
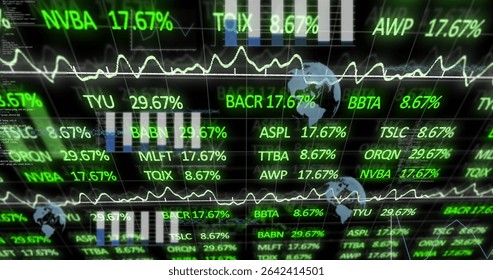
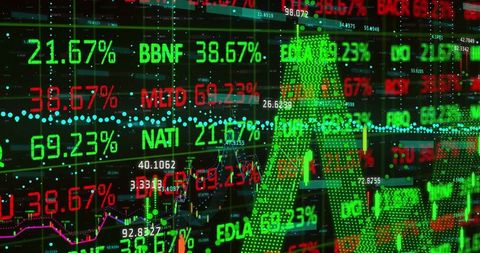
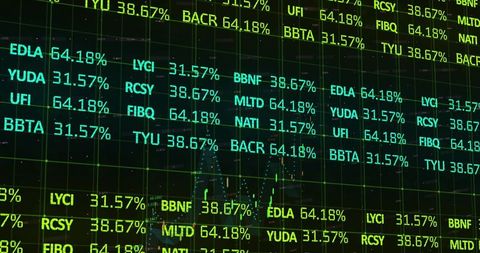
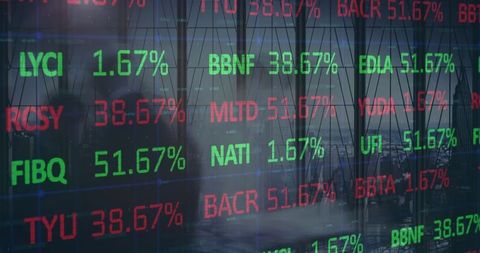
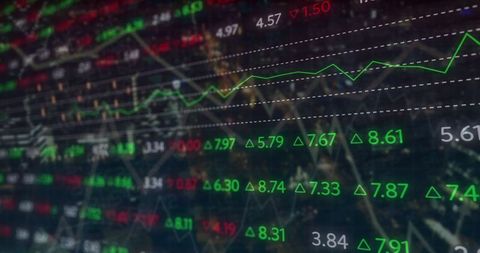
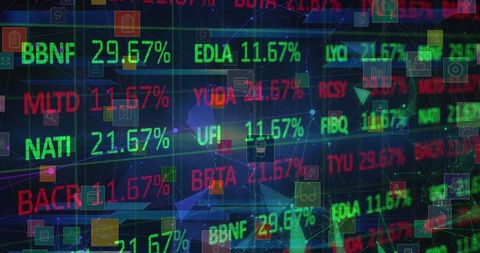
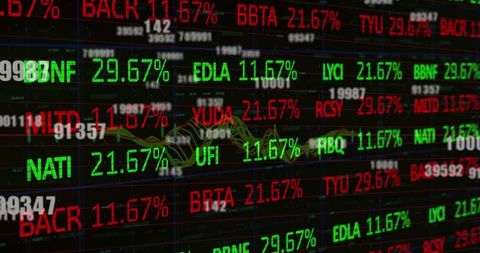
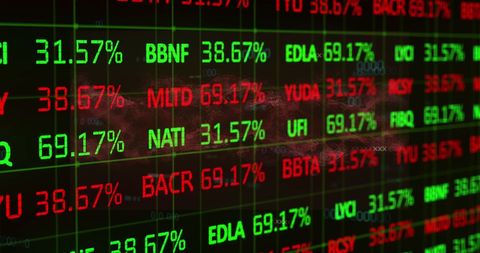
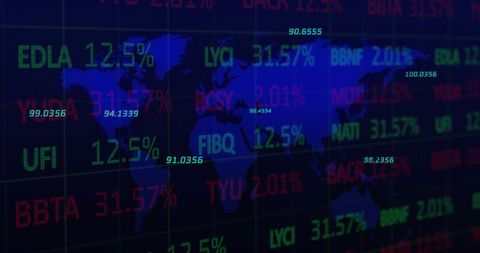
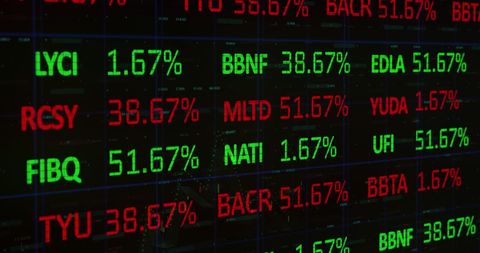
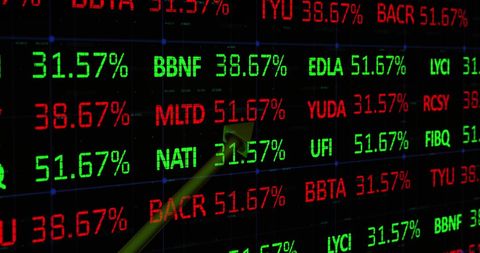
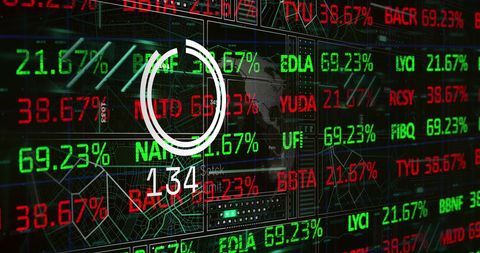
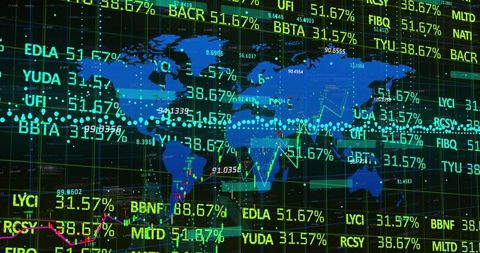
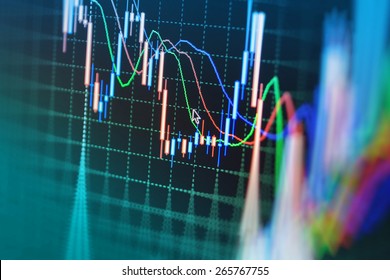
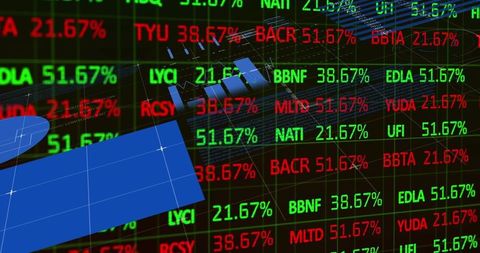
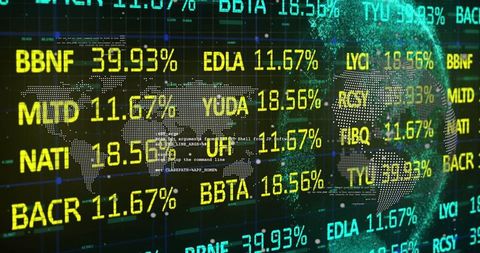
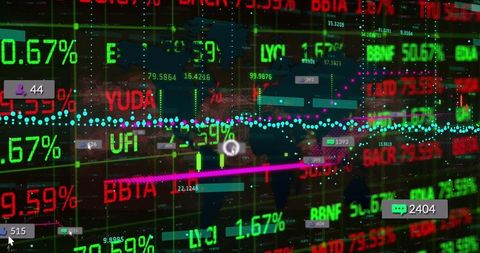
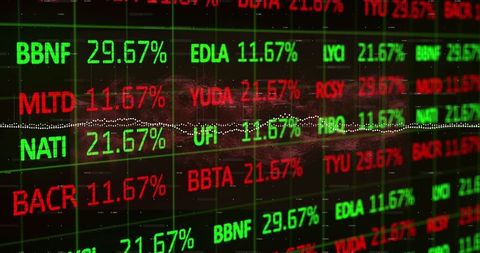
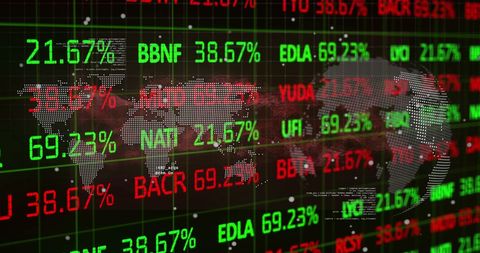
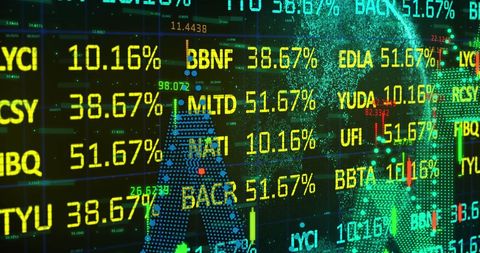
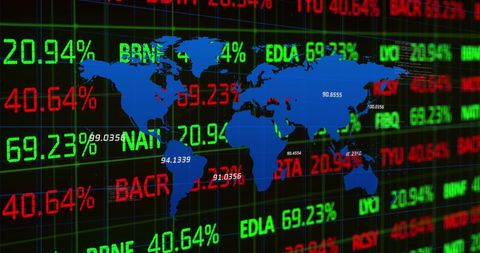
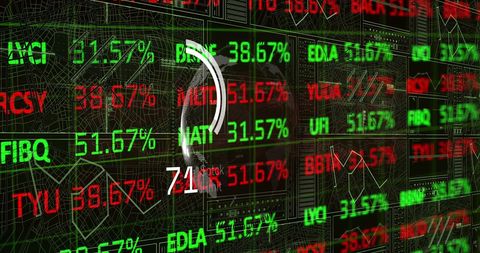
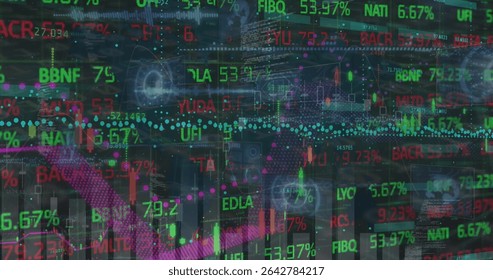
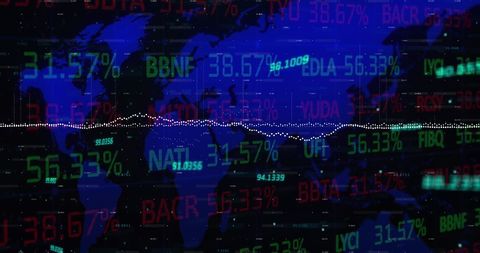
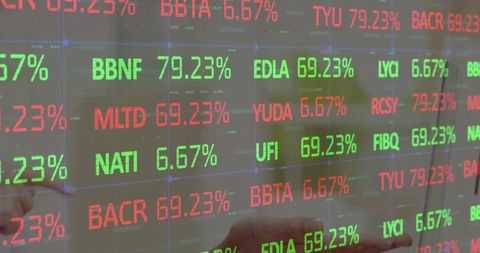
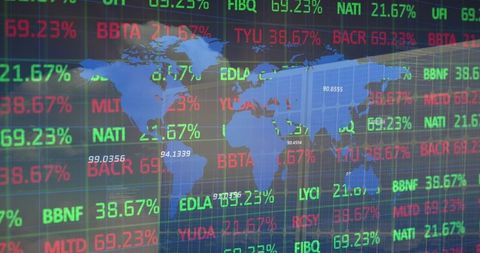
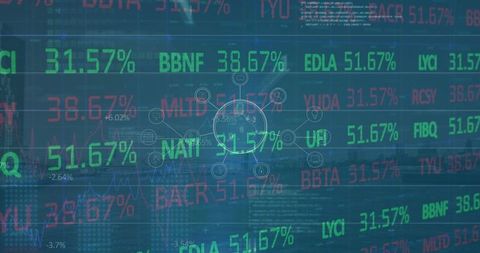
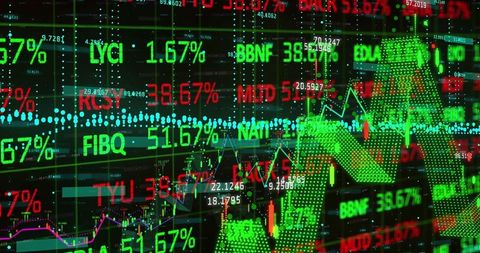
- Futuristic Stock Market Display with Charts and Percentages
Futuristic Stock Market Display with Charts and Percentages Image
Vibrant LED screen showcasing stock symbols with fluctuating percentages, bar charts, and line graphs illuminating financial markets. Useful for resources on market trends, financial analysis, and data visualization techniques in presentations, reports, and educational materials.
Powered by  - Get 15% off with code: PIKWIZARD15


downloads
Tags:
More
Credit Photo
If you would like to credit the Photo, here are some ways you can do so
Text Link
photo Link
<span class="text-link">
<span>
<a target="_blank" href=https://pikwizard.com/photo/futuristic-stock-market-display-with-charts-and-percentages/dd95e976150303641e6ced39bd4673f1/>PikWizard</a>
</span>
</span>
<span class="image-link">
<span
style="margin: 0 0 20px 0; display: inline-block; vertical-align: middle; width: 100%;"
>
<a
target="_blank"
href="https://pikwizard.com/photo/futuristic-stock-market-display-with-charts-and-percentages/dd95e976150303641e6ced39bd4673f1/"
style="text-decoration: none; font-size: 10px; margin: 0;"
>
<img src="https://pikwizard.com/pw/medium/dd95e976150303641e6ced39bd4673f1.jpg" style="margin: 0; width: 100%;" alt="" />
<p style="font-size: 12px; margin: 0;">PikWizard</p>
</a>
</span>
</span>
Free (free of charge)
Free for personal and commercial use.
Author: Creative Art
Similar Free Stock Images
Loading...

Premium


Premium


Premium

Premium

Premium


Premium
Premium

Premium


Premium


Premium

Premium
Premium


Premium

Premium


Premium


Premium

Premium
Premium


Premium

Premium

Premium


Premium
Premium

Premium

Premium