- Home >
- Stock Photos >
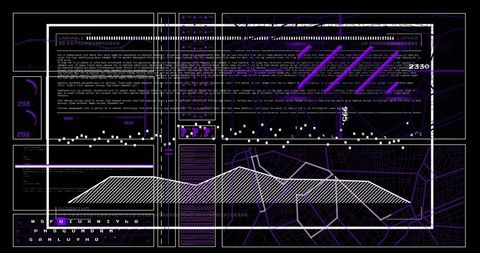
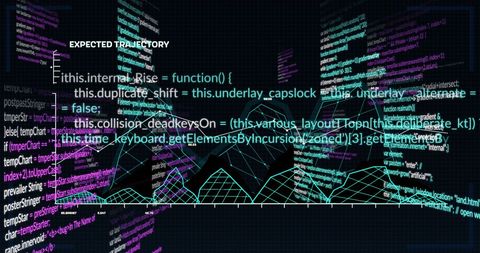
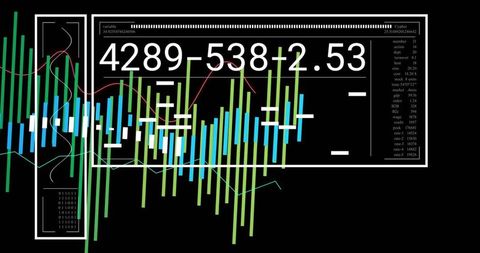
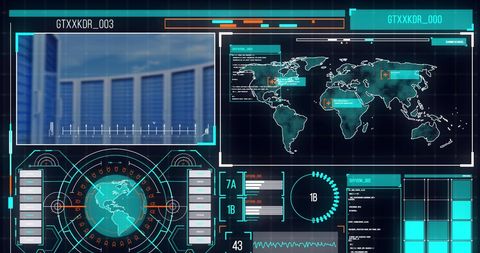
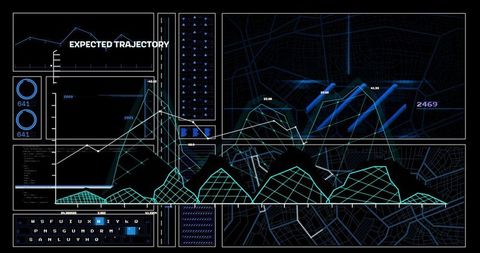
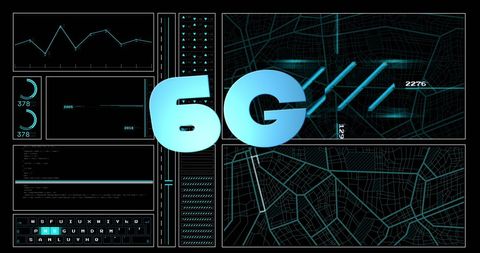
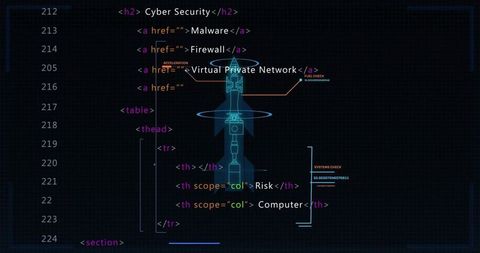
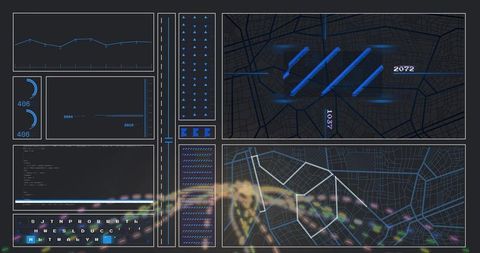
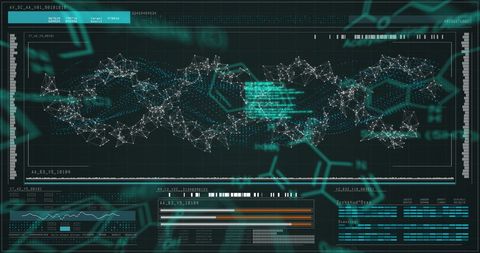
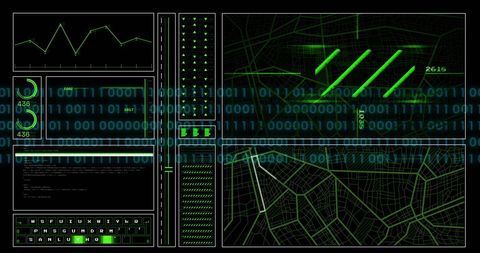
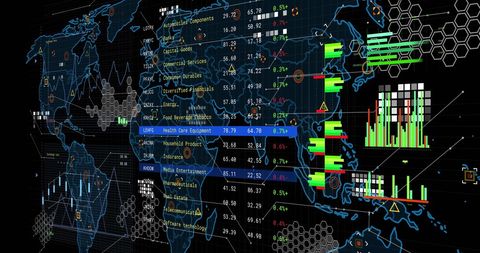
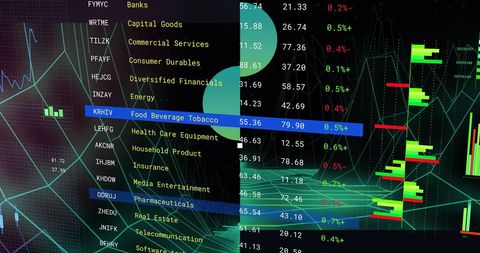
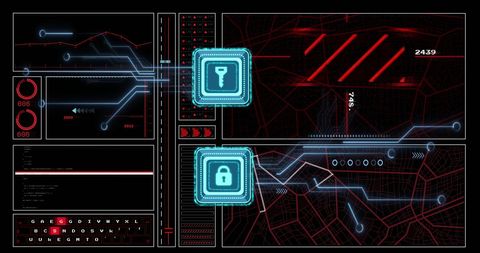
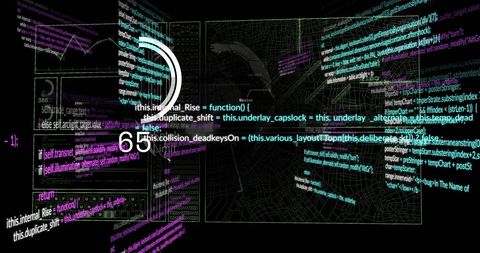
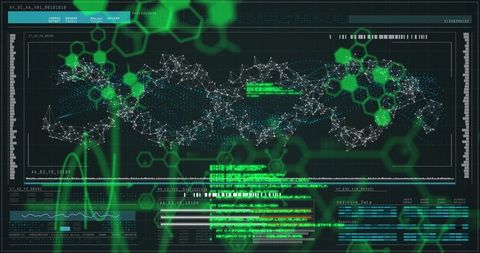
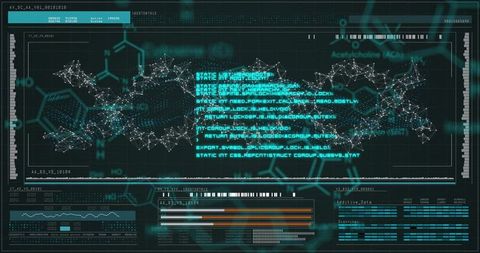
- Futuristic Tech Console with Code and Data Visualization
Futuristic Tech Console with Code and Data Visualization Image
High-tech interface featuring a mix of dense coding text, analytical charts, network grids, and wireframe maps displayed across multiple panels. These elements combine to illustrate a concept of advanced data processing and cybersecurity visuals. Useful for themes centered on technology advancements, cybersecurity solutions, digital environments, or futuristic innovation topics. Ideal for use in presentations, articles, and digital media reflecting modern tech narratives.

downloads
Tags:
More
Credit Photo
If you would like to credit the Photo, here are some ways you can do so
Text Link
photo Link
<span class="text-link">
<span>
<a target="_blank" href=https://pikwizard.com/photo/futuristic-tech-console-with-code-and-data-visualization/bf7de9b3a2338cca91bd759705e1ffcf/>PikWizard</a>
</span>
</span>
<span class="image-link">
<span
style="margin: 0 0 20px 0; display: inline-block; vertical-align: middle; width: 100%;"
>
<a
target="_blank"
href="https://pikwizard.com/photo/futuristic-tech-console-with-code-and-data-visualization/bf7de9b3a2338cca91bd759705e1ffcf/"
style="text-decoration: none; font-size: 10px; margin: 0;"
>
<img src="https://pikwizard.com/pw/medium/bf7de9b3a2338cca91bd759705e1ffcf.jpg" style="margin: 0; width: 100%;" alt="" />
<p style="font-size: 12px; margin: 0;">PikWizard</p>
</a>
</span>
</span>
Free (free of charge)
Free for personal and commercial use.
Author: People Creations