- Home >
- Stock Photos >
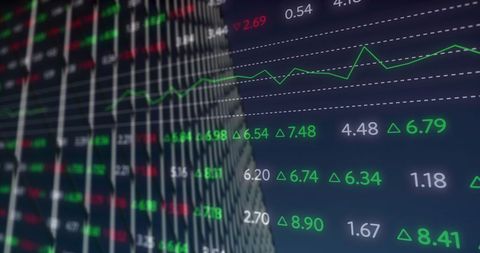
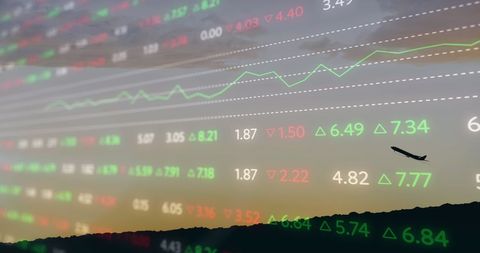
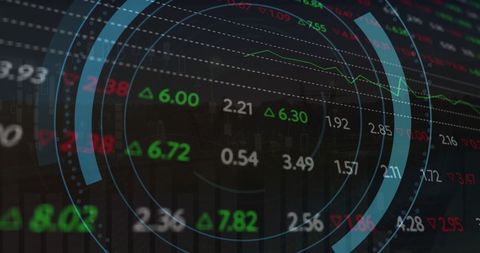
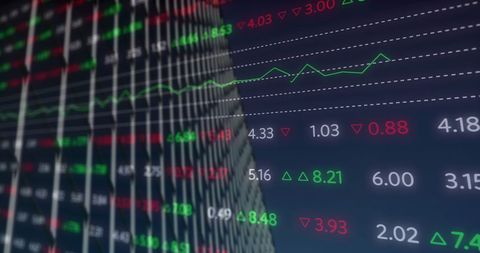
- Futuristic Tech Interface Over Stock Market Data
Futuristic Tech Interface Over Stock Market Data Image

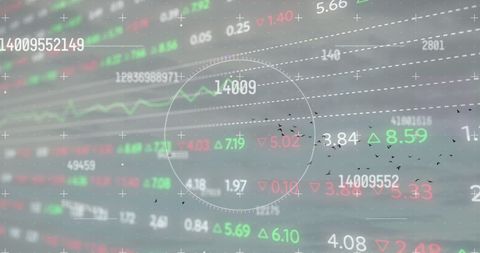
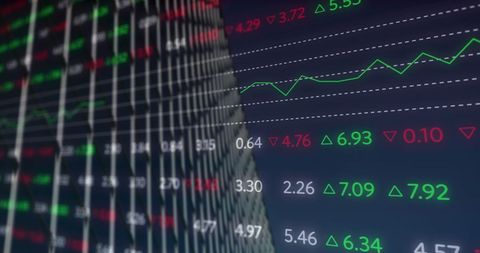
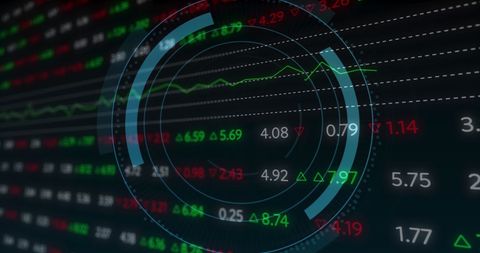
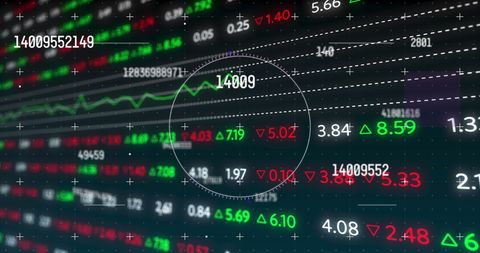
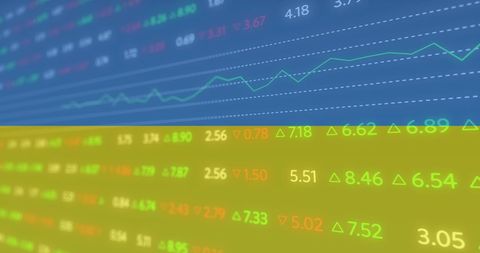
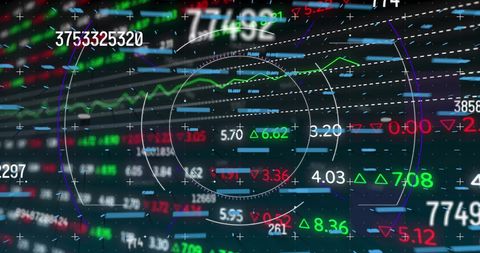
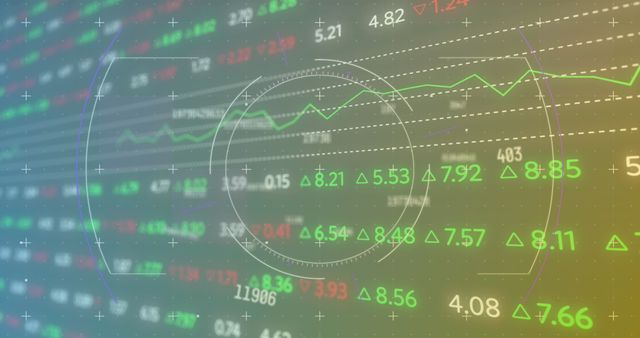
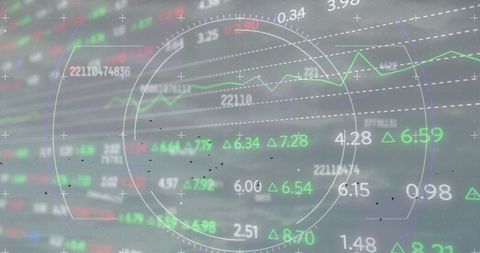
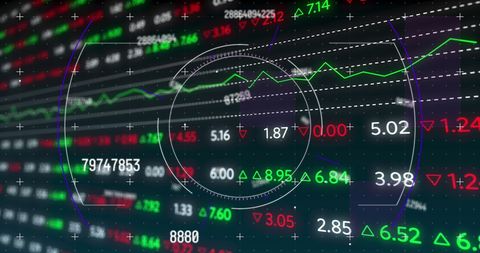
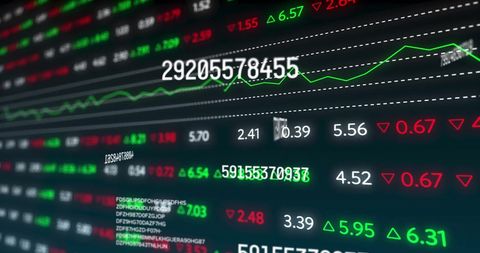
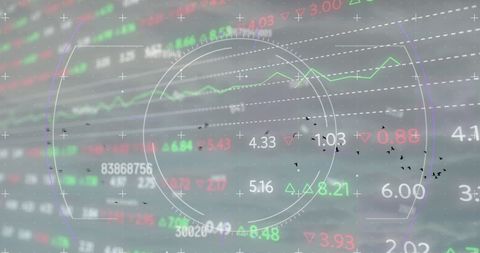
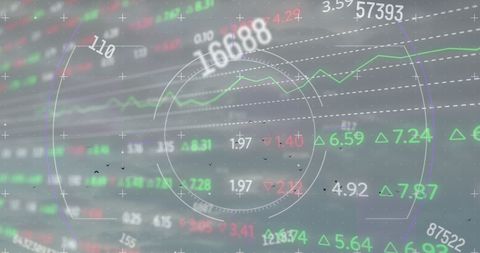
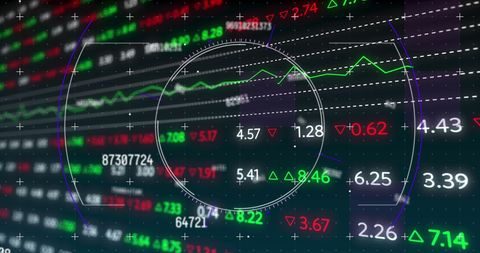
Screen showing a futuristic tech interface overlaying stock market data with green and red number data points. Ideal for use in articles about financial technology advancements, promotional materials for STEM initiatives, or educational content related to global market dynamics and economic concepts.

downloads
Tags:
More
Credit Photo
If you would like to credit the Photo, here are some ways you can do so
Text Link
photo Link
<span class="text-link">
<span>
<a target="_blank" href=https://pikwizard.com/photo/futuristic-tech-interface-over-stock-market-data/fb68c7281a77654b5fdc0498fcc629a6/>PikWizard</a>
</span>
</span>
<span class="image-link">
<span
style="margin: 0 0 20px 0; display: inline-block; vertical-align: middle; width: 100%;"
>
<a
target="_blank"
href="https://pikwizard.com/photo/futuristic-tech-interface-over-stock-market-data/fb68c7281a77654b5fdc0498fcc629a6/"
style="text-decoration: none; font-size: 10px; margin: 0;"
>
<img src="https://pikwizard.com/pw/medium/fb68c7281a77654b5fdc0498fcc629a6.jpg" style="margin: 0; width: 100%;" alt="" />
<p style="font-size: 12px; margin: 0;">PikWizard</p>
</a>
</span>
</span>
Free (free of charge)
Free for personal and commercial use.
Author: Creative Art