
- Home >
- Stock Photos >
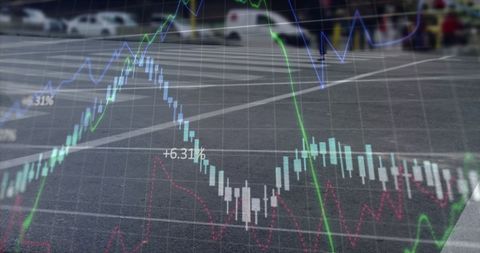
- Futuristic Technological Finance Data with Digital Analysis Grid
Futuristic Technological Finance Data with Digital Analysis Grid Image

This image illustrates vibrant digital graphs overlayed on astronomical elements like planets. It combines financial data elements with futuristic design, making it suitable for themes like technology in finance, stock market forecasts, or cyberspace extentions. Ideal for financial technology blogs, futuristic investment presentations, as well as cyber currency and innovation concept materials.
Powered by 


downloads
Tags:
More
Credit Photo
If you would like to credit the Photo, here are some ways you can do so
Text Link
photo Link
<span class="text-link">
<span>
<a target="_blank" href=https://pikwizard.com/photo/futuristic-technological-finance-data-with-digital-analysis-grid/817dc226f3fd4100668e3beeaabeab22/>PikWizard</a>
</span>
</span>
<span class="image-link">
<span
style="margin: 0 0 20px 0; display: inline-block; vertical-align: middle; width: 100%;"
>
<a
target="_blank"
href="https://pikwizard.com/photo/futuristic-technological-finance-data-with-digital-analysis-grid/817dc226f3fd4100668e3beeaabeab22/"
style="text-decoration: none; font-size: 10px; margin: 0;"
>
<img src="https://pikwizard.com/pw/medium/817dc226f3fd4100668e3beeaabeab22.jpg" style="margin: 0; width: 100%;" alt="" />
<p style="font-size: 12px; margin: 0;">PikWizard</p>
</a>
</span>
</span>
Free (free of charge)
Free for personal and commercial use.
Author: People Creations
Similar Free Stock Images

Premium

Premium

Premium


Premium


Premium

Premium


Premium


Premium


Premium

Premium

Premium


Premium


Premium


Premium


Premium


Premium


AI


Premium


Premium


Premium


Premium

Premium

Premium


Premium


Premium


Premium


Explore More Free Stock Images