
- Home >
- Stock Photos >
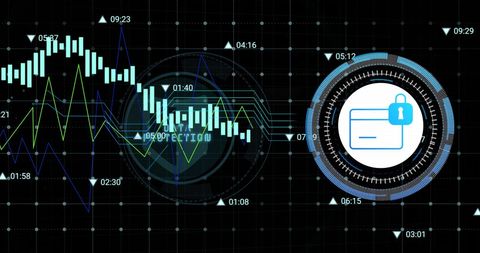
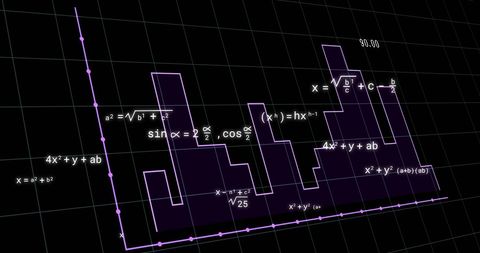
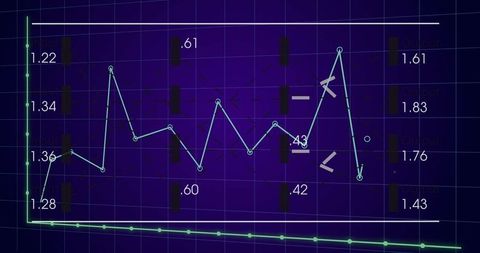
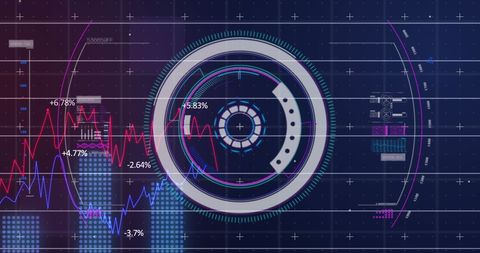
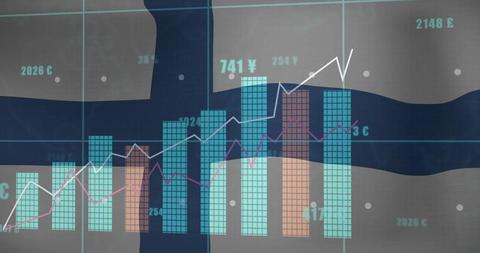
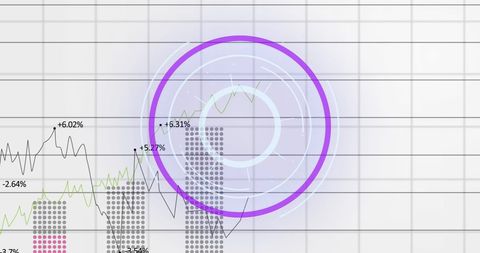
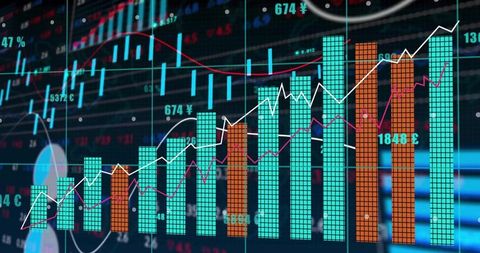
- Futuristic Technology Data Dashboard with Graphs and Charts
Futuristic Technology Data Dashboard with Graphs and Charts Image
Futuristic dashboard conveys sense of high-technology data interfacing with various charts and graphs. Featuring bar charts, line graphs and gauge on a dark grid to indicate advanced analytics and digital data processing. Perfect for illustrating concepts in technology innovation, big data analytics, advanced digital interfaces, programming dashboards, and technology-related publications.
Powered by  - Get 15% off with code: PIKWIZARD15


downloads
Tags:
More
Credit Photo
If you would like to credit the Photo, here are some ways you can do so
Text Link
photo Link
<span class="text-link">
<span>
<a target="_blank" href=https://pikwizard.com/photo/futuristic-technology-data-dashboard-with-graphs-and-charts/6c045b52818d0d2d7a6c528bd48cdc48/>PikWizard</a>
</span>
</span>
<span class="image-link">
<span
style="margin: 0 0 20px 0; display: inline-block; vertical-align: middle; width: 100%;"
>
<a
target="_blank"
href="https://pikwizard.com/photo/futuristic-technology-data-dashboard-with-graphs-and-charts/6c045b52818d0d2d7a6c528bd48cdc48/"
style="text-decoration: none; font-size: 10px; margin: 0;"
>
<img src="https://pikwizard.com/pw/medium/6c045b52818d0d2d7a6c528bd48cdc48.jpg" style="margin: 0; width: 100%;" alt="" />
<p style="font-size: 12px; margin: 0;">PikWizard</p>
</a>
</span>
</span>
Free (free of charge)
Free for personal and commercial use.
Author: Awesome Content
Similar Free Stock Images

Premium


Premium


Premium


Premium


Premium


Premium


Premium


Premium


Premium


Premium

Premium


Premium

Premium


Premium

Premium


Premium


Premium


Premium


Premium


Premium


Premium


Premium


Premium


Premium


Premium


Explore More Free Stock Images