
- Home >
- Stock Photos >
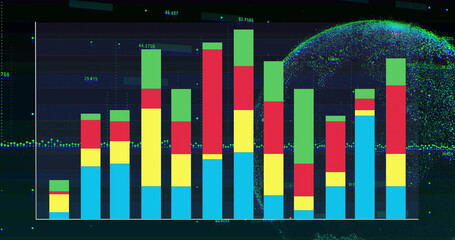
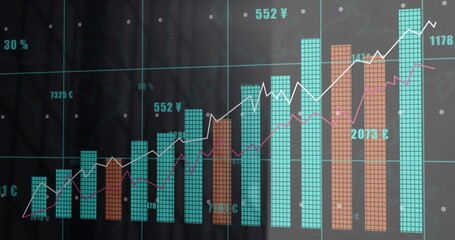
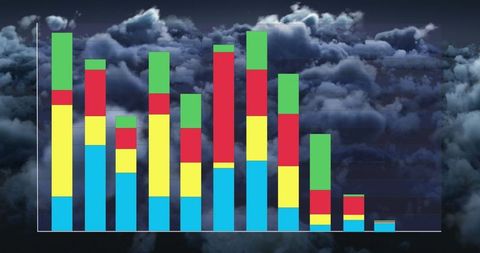
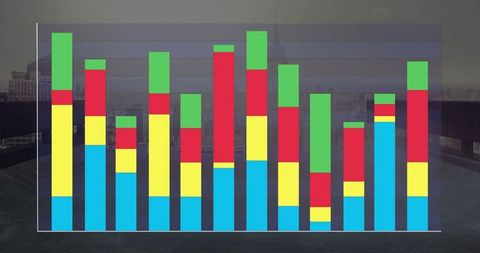
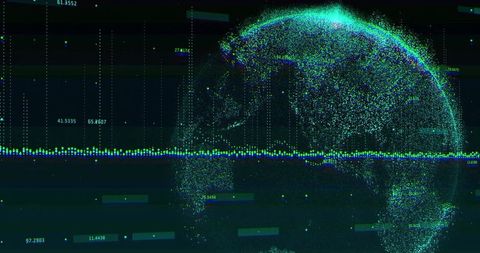
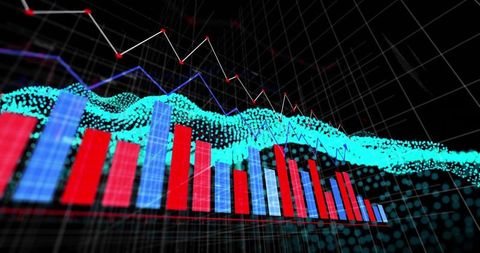
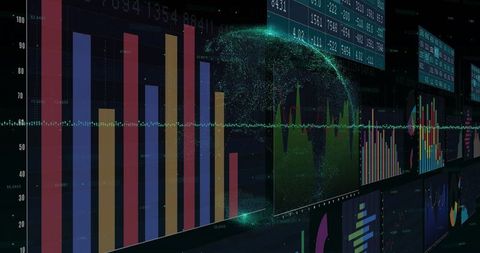
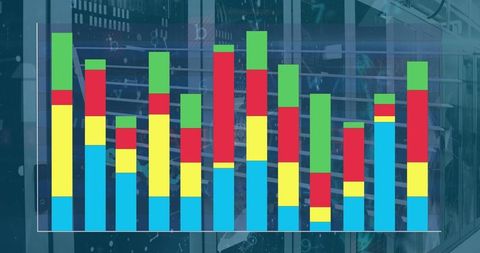
- Futuristic Technology Stacked Bar Chart Visualization
Futuristic Technology Stacked Bar Chart Visualization Image

Visually engaging and colorful stacked bar chart featuring divisions denoted by different colors on an advanced digital dashboard. Surrounding the chart, a digital globe and intricate dotted lines add a futuristic appeal fostering analytical storytelling. Used for illustrating data insights, display analysis, or representation in tech-related articles.
Powered by 


downloads
Tags:
More
Credit Photo
If you would like to credit the Photo, here are some ways you can do so
Text Link
photo Link
<span class="text-link">
<span>
<a target="_blank" href=https://pikwizard.com/photo/futuristic-technology-stacked-bar-chart-visualization/61f995abd3268729ff02ee0dedf39c7b/>PikWizard</a>
</span>
</span>
<span class="image-link">
<span
style="margin: 0 0 20px 0; display: inline-block; vertical-align: middle; width: 100%;"
>
<a
target="_blank"
href="https://pikwizard.com/photo/futuristic-technology-stacked-bar-chart-visualization/61f995abd3268729ff02ee0dedf39c7b/"
style="text-decoration: none; font-size: 10px; margin: 0;"
>
<img src="https://pikwizard.com/pw/medium/61f995abd3268729ff02ee0dedf39c7b.jpg" style="margin: 0; width: 100%;" alt="" />
<p style="font-size: 12px; margin: 0;">PikWizard</p>
</a>
</span>
</span>
Free (free of charge)
Free for personal and commercial use.
Author: Creative Art
Similar Free Stock Images

Premium


Premium

Premium


Premium


Premium


Premium


Premium
Premium


Premium

Premium


Premium


Premium


Premium

Premium


Premium


Premium


Premium


Premium


Premium


Premium


Premium


Explore More Free Stock Images