
- Home >
- Stock Photos >
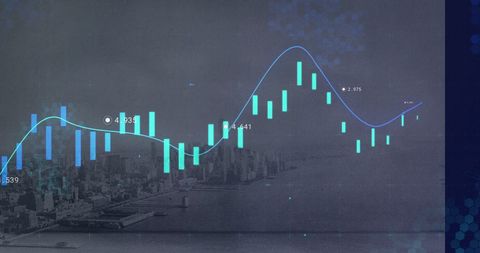
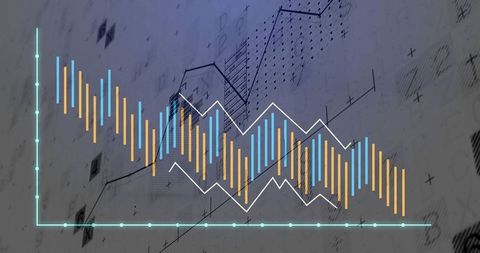
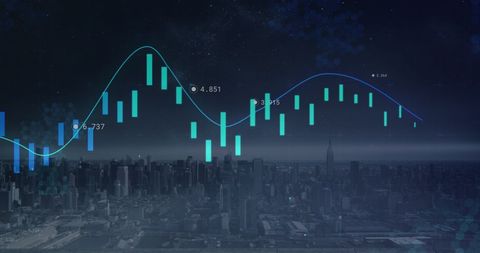
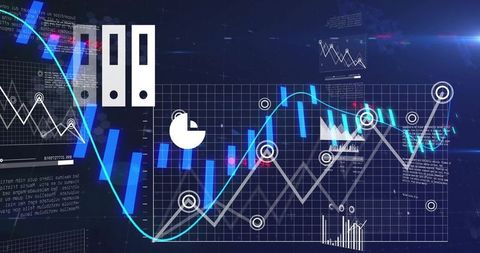
- Futuristic Trading and Data Analysis Platform with Trend Visualizations
Futuristic Trading and Data Analysis Platform with Trend Visualizations Image

Digital platform highlights dynamic trend lines in blue and purple along with teal bar graphs. Ideal for articles or content related to finance, stock market analysis, digital technology, or investment strategies. Suitable for business presentations and educational resources focused on fintech and data science advancements.
Powered by 


downloads
Tags:
More
Credit Photo
If you would like to credit the Photo, here are some ways you can do so
Text Link
photo Link
<span class="text-link">
<span>
<a target="_blank" href=https://pikwizard.com/photo/futuristic-trading-and-data-analysis-platform-with-trend-visualizations/4b04ca866ee0d56b055543d7b65b625d/>PikWizard</a>
</span>
</span>
<span class="image-link">
<span
style="margin: 0 0 20px 0; display: inline-block; vertical-align: middle; width: 100%;"
>
<a
target="_blank"
href="https://pikwizard.com/photo/futuristic-trading-and-data-analysis-platform-with-trend-visualizations/4b04ca866ee0d56b055543d7b65b625d/"
style="text-decoration: none; font-size: 10px; margin: 0;"
>
<img src="https://pikwizard.com/pw/medium/4b04ca866ee0d56b055543d7b65b625d.jpg" style="margin: 0; width: 100%;" alt="" />
<p style="font-size: 12px; margin: 0;">PikWizard</p>
</a>
</span>
</span>
Free (free of charge)
Free for personal and commercial use.
Author: Authentic Images
Similar Free Stock Images

Premium


Premium
Premium

Premium


Premium

Premium


Premium


Premium


Premium


Premium


Premium


Premium


Premium


Premium


Premium


Premium


Premium


Premium


Premium


Premium


Premium

Premium


Premium
Premium


Premium


Explore More Free Stock Images