- Home >
- Stock Photos >
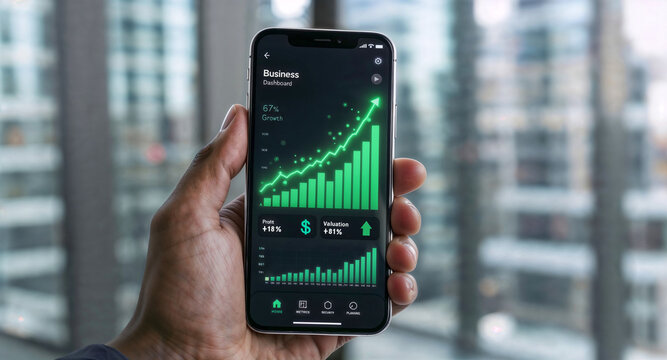
- Futuristic Trading Dashboard Visualizing Stock Market Data with Radial Infographic
Futuristic Trading Dashboard Visualizing Stock Market Data with Radial Infographic Image

Futuristic dashboard visualizing stock market performance using radial infographic, multi-line charts, percentage labels, and ticker readouts. Suited for fintech websites, trading platforms, investor presentations, pitch decks, marketing campaigns, and data analytics articles. Use as hero background, slide header, blog feature, app UI mockup, or social media graphic. Recommend dark tech color palette with neon accents, space on right for text overlay, and cropping for wide banner or square social formats. Consider adding subtle animation or parallax for web hero and using close crop on radial infographic for detailed product shots.
Powered by 


0
downloads
downloads
Tags:
More
Credit Photo
If you would like to credit the Photo, here are some ways you can do so
Text Link
photo Link
<span class="text-link">
<span>
<a target="_blank" href=https://pikwizard.com/photo/futuristic-trading-dashboard-visualizing-stock-market-data-with-radial-infographic/b9f9f2da5f7d832135d3f2bbcd95c102/>PikWizard</a>
</span>
</span>
<span class="image-link">
<span
style="margin: 0 0 20px 0; display: inline-block; vertical-align: middle; width: 100%;"
>
<a
target="_blank"
href="https://pikwizard.com/photo/futuristic-trading-dashboard-visualizing-stock-market-data-with-radial-infographic/b9f9f2da5f7d832135d3f2bbcd95c102/"
style="text-decoration: none; font-size: 10px; margin: 0;"
>
<img src="https://pikwizard.com/pw/medium/b9f9f2da5f7d832135d3f2bbcd95c102.jpg" style="margin: 0; width: 100%;" alt="" />
<p style="font-size: 12px; margin: 0;">PikWizard</p>
</a>
</span>
</span>
Free (free of charge)
Free for personal and commercial use.
Author: Authentic Images
Similar Free Stock Images

Premium


Premium


Premium


Premium


Premium


Premium


Premium


Premium


Premium


Premium


Premium


Premium


Premium


Premium


Premium


Premium


Premium


Premium


Premium


Premium


Premium


Premium


Premium


Premium