- Home >
- Stock Photos >
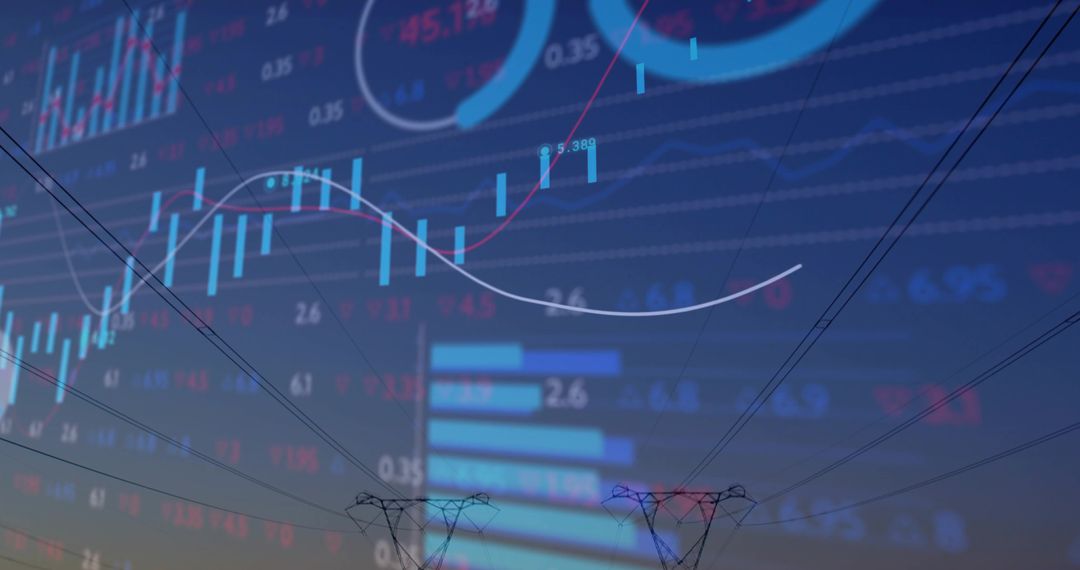
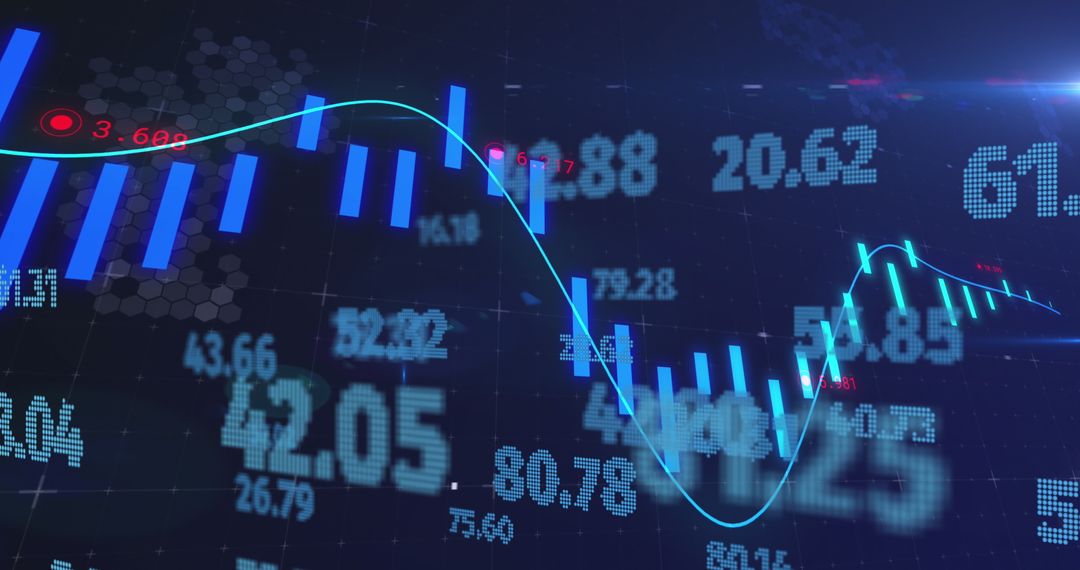
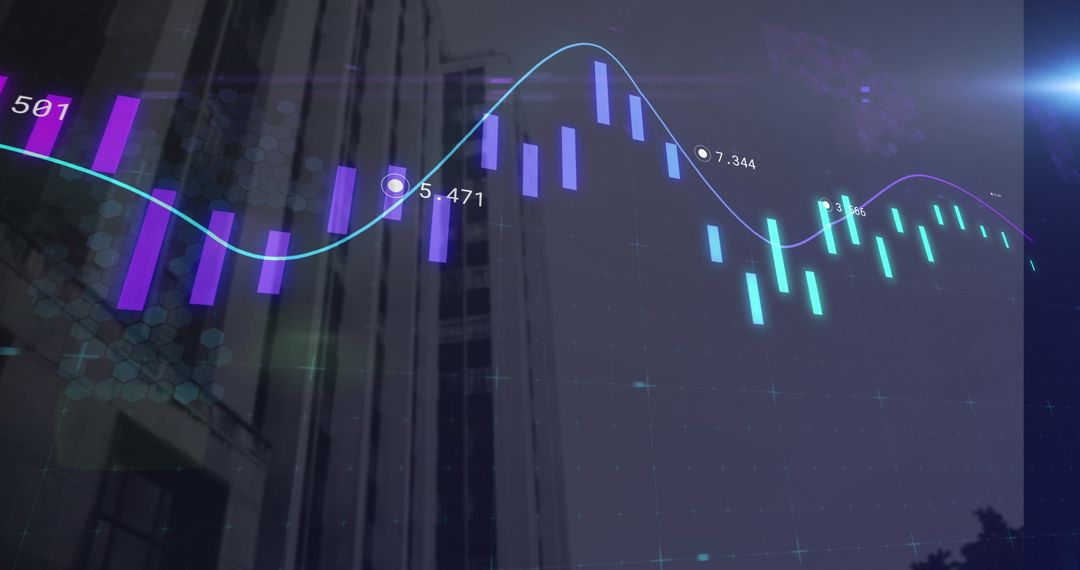
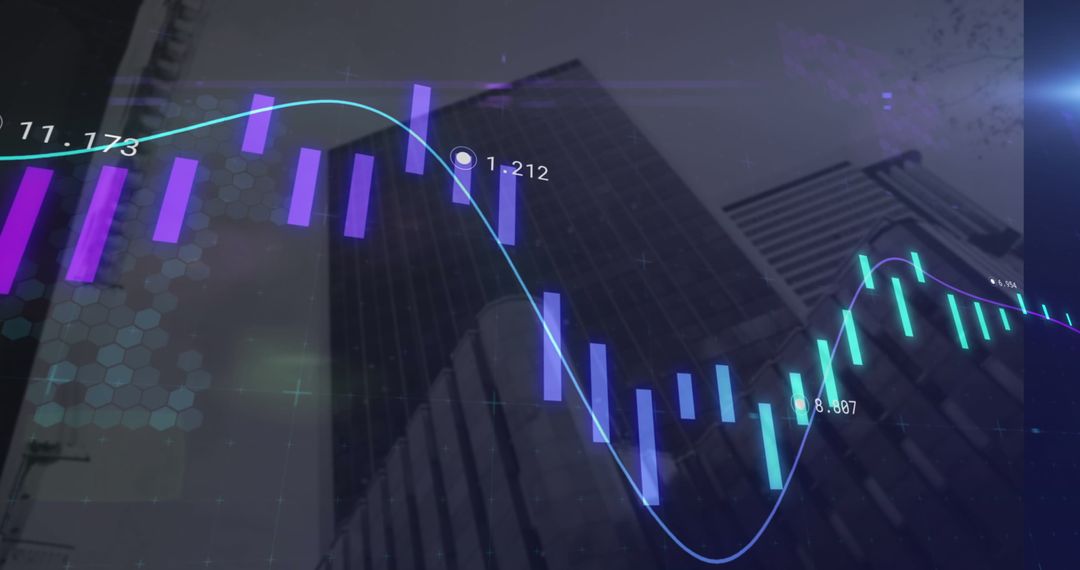
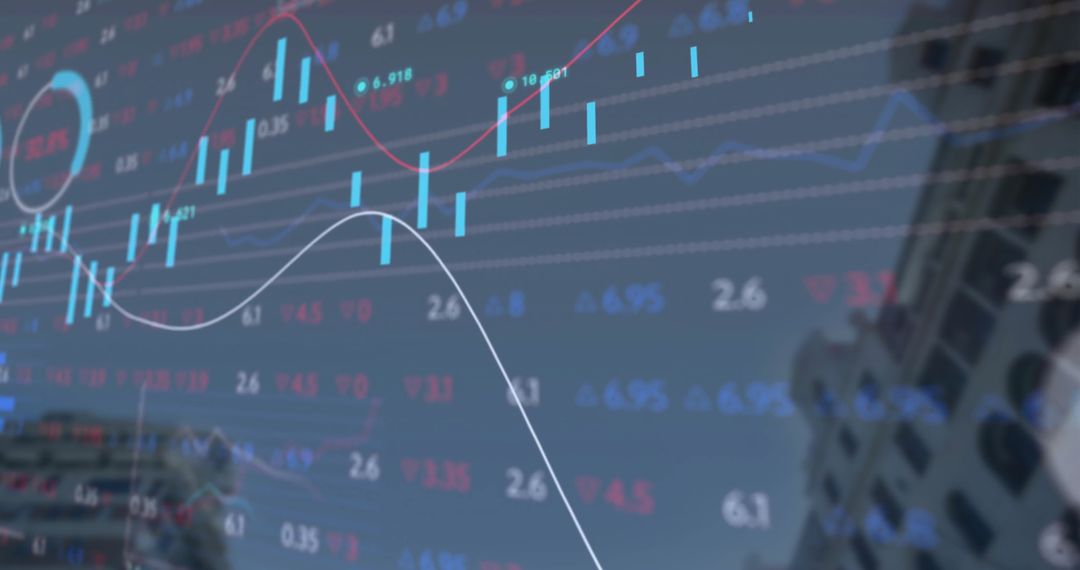
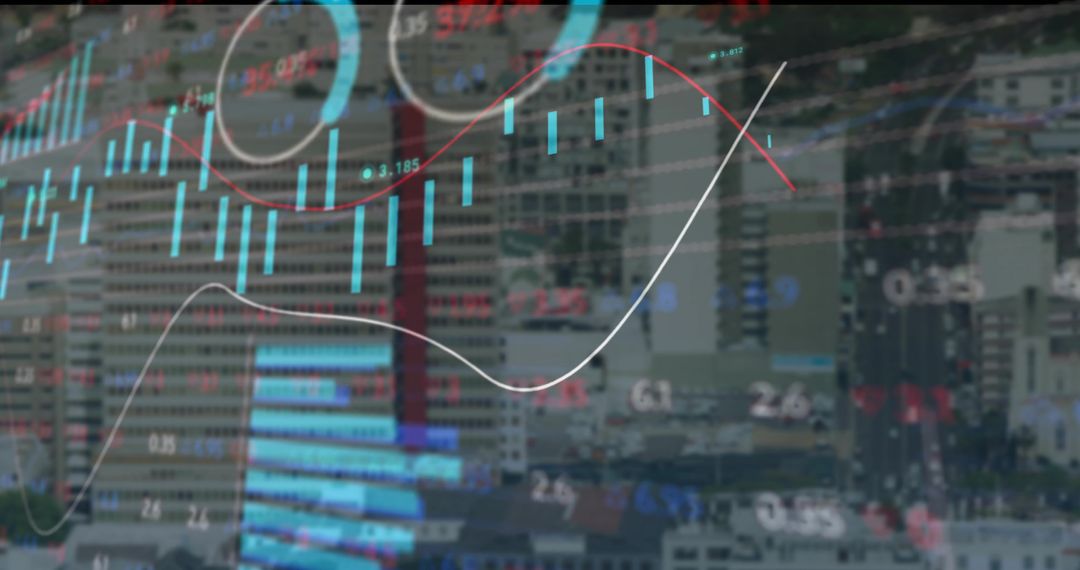
- Futuristic Trading Dashboard with Analytics and Graphs
Futuristic Trading Dashboard with Analytics and Graphs Image

Visual displays dynamic blend of trading activities with outlines of wireframe mesh intersecting graphs, indicating connection of data points. Interactive elements display quantitative data through candlestick bars. Streamlined and modern, resonates with financial analysts or educators giving insights into trading technologies. Can enhance banking presentations, online economics courses and website backgrounds focusing on financial technology.
Powered by  - Get 15% off with code: PIKWIZARD15


2
downloads
downloads
Tags:
More
Credit Photo
If you would like to credit the Photo, here are some ways you can do so
Text Link
photo Link
<span class="text-link">
<span>
<a target="_blank" href=https://pikwizard.com/photo/futuristic-trading-dashboard-with-analytics-and-graphs/3a9b8ca0353af10cc47de3d14075d780/>PikWizard</a>
</span>
</span>
<span class="image-link">
<span
style="margin: 0 0 20px 0; display: inline-block; vertical-align: middle; width: 100%;"
>
<a
target="_blank"
href="https://pikwizard.com/photo/futuristic-trading-dashboard-with-analytics-and-graphs/3a9b8ca0353af10cc47de3d14075d780/"
style="text-decoration: none; font-size: 10px; margin: 0;"
>
<img src="https://pikwizard.com/pw/medium/3a9b8ca0353af10cc47de3d14075d780.jpg" style="margin: 0; width: 100%;" alt="" />
<p style="font-size: 12px; margin: 0;">PikWizard</p>
</a>
</span>
</span>
Free (free of charge)
Free for personal and commercial use.
Author: Authentic Images
Similar Free Stock Images

Premium


Premium


Premium


Premium


Premium


Premium


Premium


Premium


Premium


Premium


Premium


Premium


Premium


Premium


Premium


Premium


Premium


Premium


Premium


Premium


Premium


Premium


Premium


Premium