- Home >
- Stock Photos >
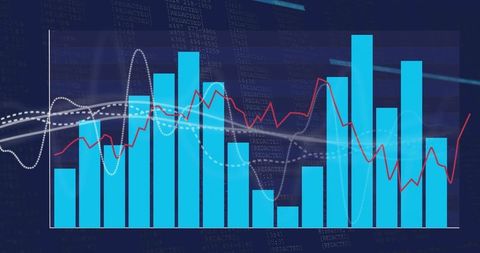
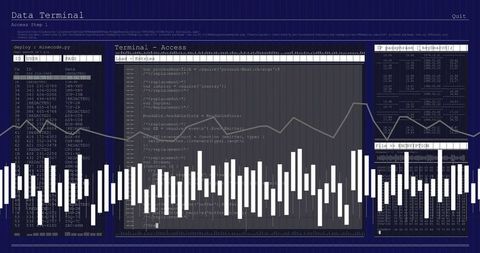
- Futuristic Trading Dashboard with Neon Graphs and Data Visualization
Futuristic Trading Dashboard with Neon Graphs and Data Visualization Image

Futuristic representation of a trading dashboard displaying neon line graphs and two-tone bar graphs overlaying a world map. Blurred panels signify dynamic and complex data analytics. Ideal for illustrating concepts related to financial technology, stock market analysis, investment strategy, or cyber-oriented financial tools. This visual blends technology and economics, emphasizing data-driven decision-making and innovative investment approaches.

downloads
Tags:
More
Credit Photo
If you would like to credit the Photo, here are some ways you can do so
Text Link
photo Link
<span class="text-link">
<span>
<a target="_blank" href=https://pikwizard.com/photo/futuristic-trading-dashboard-with-neon-graphs-and-data-visualization/d19a71feaf2ac647f9418da75825b96a/>PikWizard</a>
</span>
</span>
<span class="image-link">
<span
style="margin: 0 0 20px 0; display: inline-block; vertical-align: middle; width: 100%;"
>
<a
target="_blank"
href="https://pikwizard.com/photo/futuristic-trading-dashboard-with-neon-graphs-and-data-visualization/d19a71feaf2ac647f9418da75825b96a/"
style="text-decoration: none; font-size: 10px; margin: 0;"
>
<img src="https://pikwizard.com/pw/medium/d19a71feaf2ac647f9418da75825b96a.jpg" style="margin: 0; width: 100%;" alt="" />
<p style="font-size: 12px; margin: 0;">PikWizard</p>
</a>
</span>
</span>
Free (free of charge)
Free for personal and commercial use.
Author: Awesome Content