
- Home >
- Stock Photos >
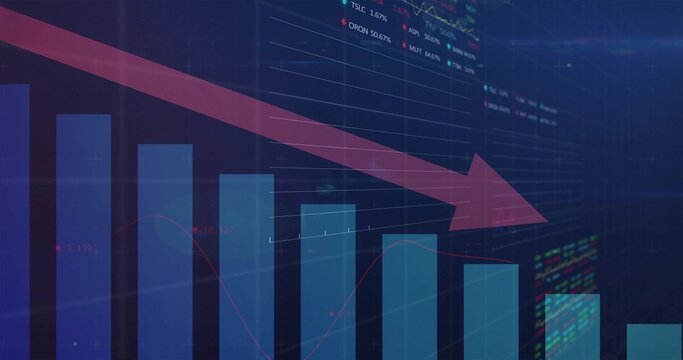
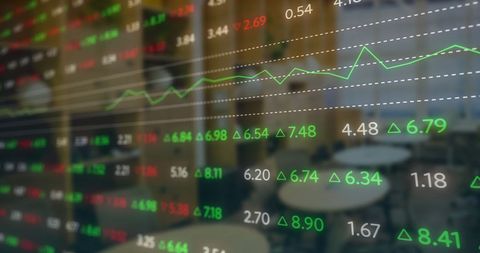
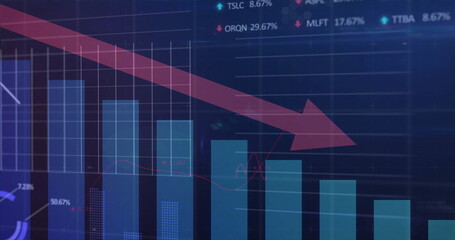
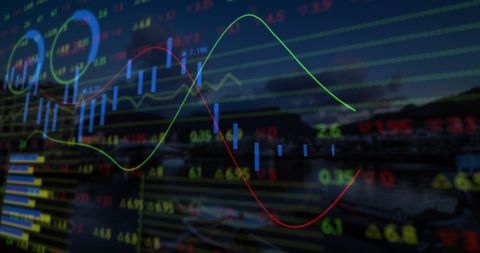
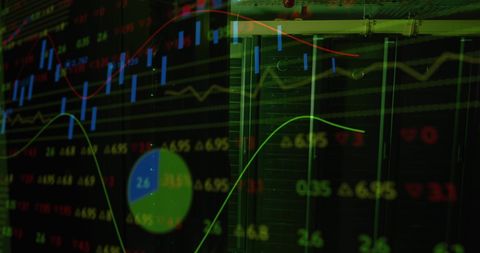
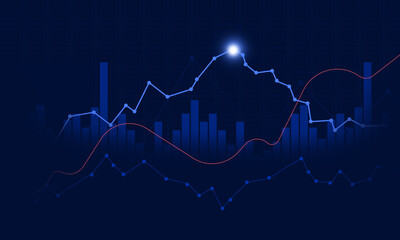
- Futuristic Trading Interface with Declining Trend
Futuristic Trading Interface with Declining Trend Image

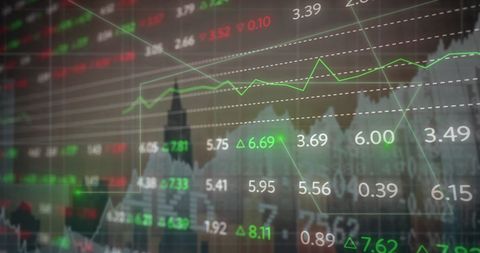
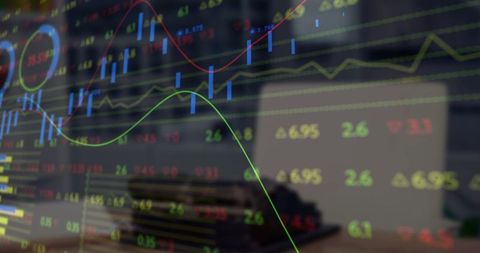
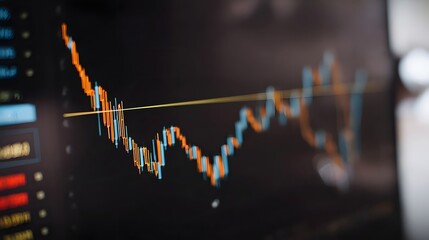
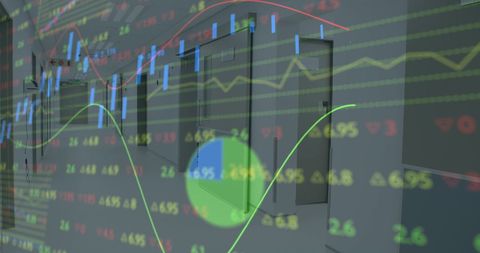
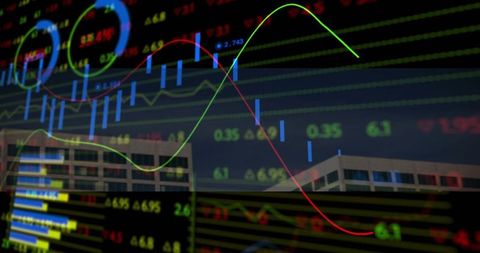
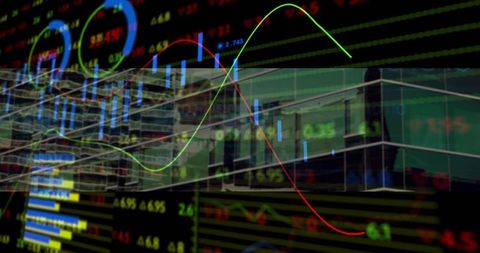
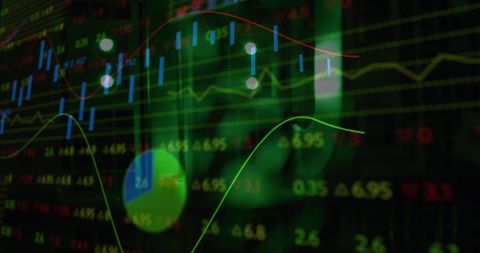
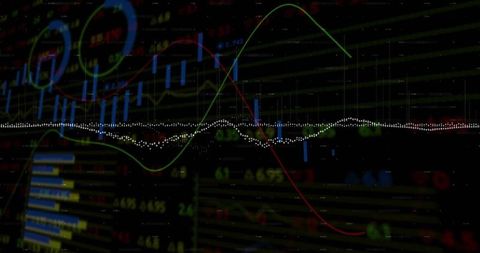
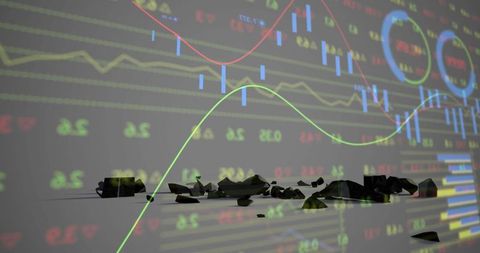
This visual demonstrates a complex trading interface showcasing digital analytics with various chart elements including candlesticks, line graphs, and bar charts. The presence of a downward arrow suggests a declining market trend, suitable for illustrating the complexities of financial data processing. This is ideal for articles or presentations on digital finance, investment strategies, market analysis, or economic behavior studies.
Powered by 


downloads
Tags:
More
Credit Photo
If you would like to credit the Photo, here are some ways you can do so
Text Link
photo Link
<span class="text-link">
<span>
<a target="_blank" href=https://pikwizard.com/photo/futuristic-trading-interface-with-declining-trend/674b3b1ff4acdb444f0b3447b740d7fc/>PikWizard</a>
</span>
</span>
<span class="image-link">
<span
style="margin: 0 0 20px 0; display: inline-block; vertical-align: middle; width: 100%;"
>
<a
target="_blank"
href="https://pikwizard.com/photo/futuristic-trading-interface-with-declining-trend/674b3b1ff4acdb444f0b3447b740d7fc/"
style="text-decoration: none; font-size: 10px; margin: 0;"
>
<img src="https://pikwizard.com/pw/medium/674b3b1ff4acdb444f0b3447b740d7fc.jpg" style="margin: 0; width: 100%;" alt="" />
<p style="font-size: 12px; margin: 0;">PikWizard</p>
</a>
</span>
</span>
Free (free of charge)
Free for personal and commercial use.
Author: Creative Art
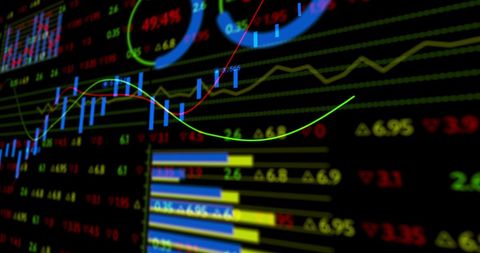
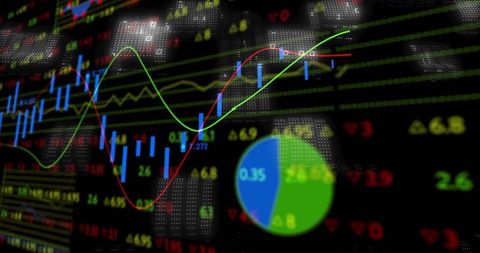
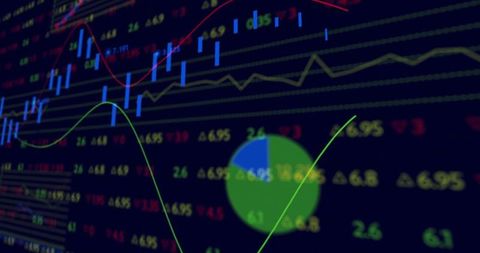
Similar Free Stock Images

Premium


Premium
Premium


Premium


Premium


Premium


Premium


Premium


Premium


Premium


Premium


Premium


Premium
Premium


Premium


Premium
Premium


Premium


Premium

Premium


Premium


Premium


Premium


Premium


Premium
Explore More Free Stock Images