- Home >
- Stock Photos >
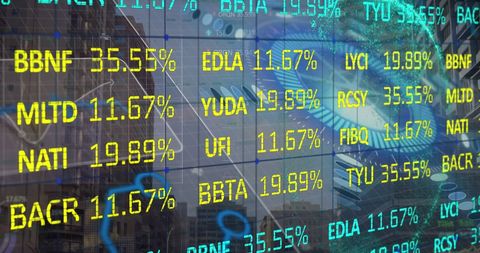
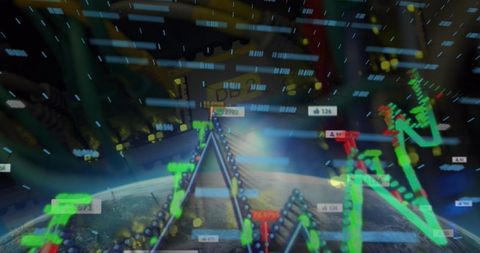
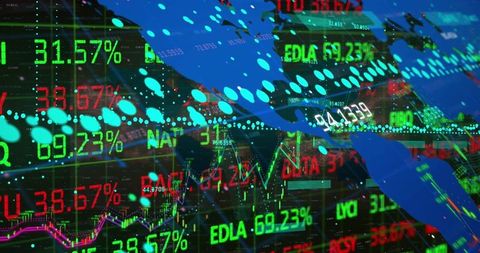
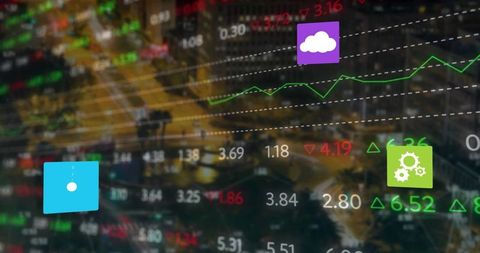
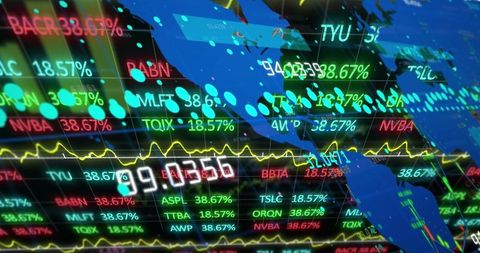
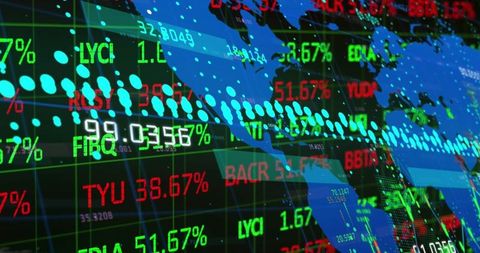
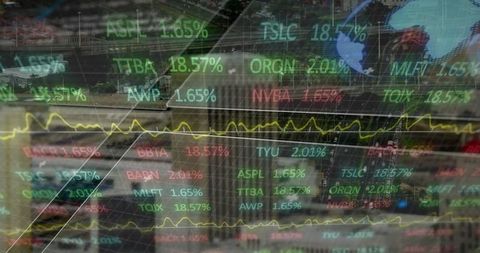
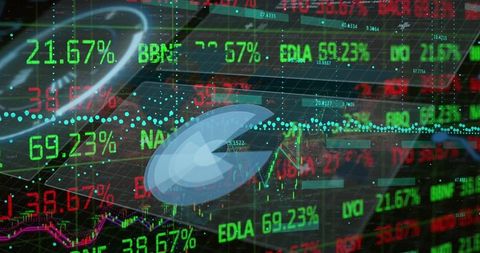
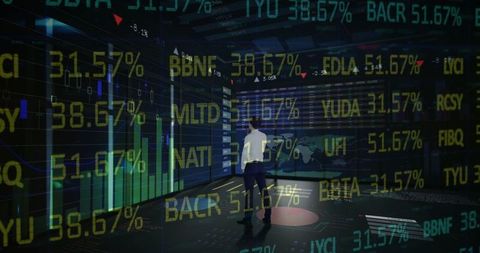
- Futuristic Trading Interface with Stock Tickers
Futuristic Trading Interface with Stock Tickers Image
This dynamic visualization combines graphic elements of technology and finance, ideal for depicting future-oriented trading platforms. Use this in financial presentations, fintech marketing materials, or consulting brochures to illustrate advanced analytics and data tracking. Its vivid colors and overlays serve as powerful metaphors for digital finance evolution and business innovation.

downloads
Tags:
More
Credit Photo
If you would like to credit the Photo, here are some ways you can do so
Text Link
photo Link
<span class="text-link">
<span>
<a target="_blank" href=https://pikwizard.com/photo/futuristic-trading-interface-with-stock-tickers/cae2392bf259da8b7b82c0f5cf11e498/>PikWizard</a>
</span>
</span>
<span class="image-link">
<span
style="margin: 0 0 20px 0; display: inline-block; vertical-align: middle; width: 100%;"
>
<a
target="_blank"
href="https://pikwizard.com/photo/futuristic-trading-interface-with-stock-tickers/cae2392bf259da8b7b82c0f5cf11e498/"
style="text-decoration: none; font-size: 10px; margin: 0;"
>
<img src="https://pikwizard.com/pw/medium/cae2392bf259da8b7b82c0f5cf11e498.jpg" style="margin: 0; width: 100%;" alt="" />
<p style="font-size: 12px; margin: 0;">PikWizard</p>
</a>
</span>
</span>
Free (free of charge)
Free for personal and commercial use.
Author: Creative Art