- Home >
- Stock Photos >
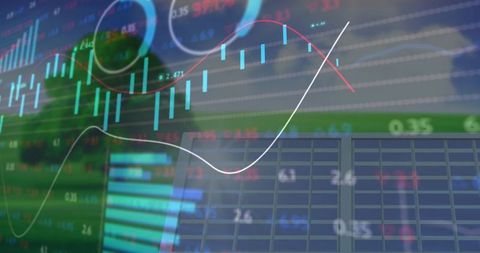
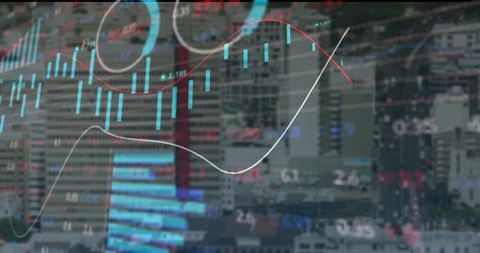
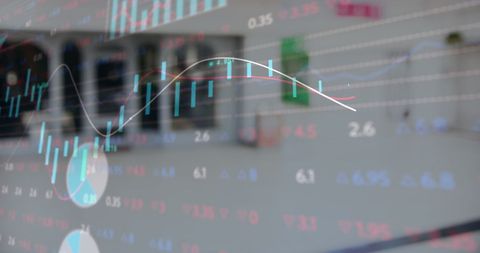
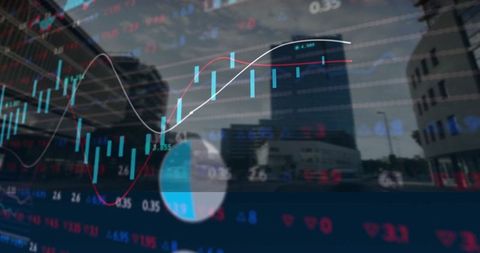
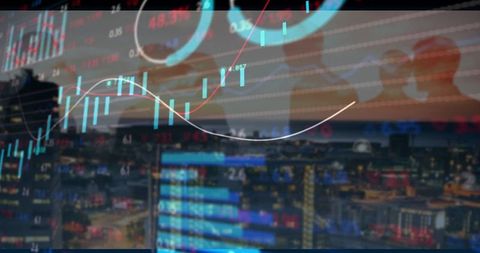
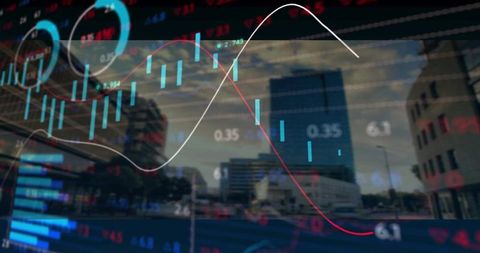
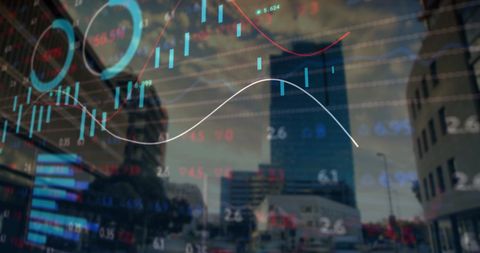
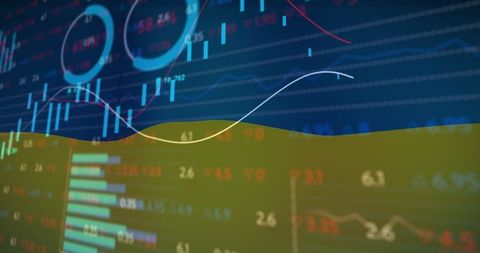
- Futuristic Transparent Screen Displaying Stock Market Data
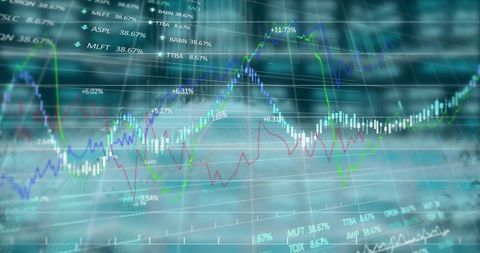
Futuristic Transparent Screen Displaying Stock Market Data Image

Visually engaging depiction ideal for conveying concepts of finance, data analysis, and technology. Perfect for use in articles about market trends, finance reports, analytics tools, or investment strategies.
Powered by  - Get 15% off with code: PIKWIZARD15


downloads
Tags:
More
Credit Photo
If you would like to credit the Photo, here are some ways you can do so
Text Link
photo Link
<span class="text-link">
<span>
<a target="_blank" href=https://pikwizard.com/photo/futuristic-transparent-screen-displaying-stock-market-data/567cdd755a14f989fec7cd08be3064de/>PikWizard</a>
</span>
</span>
<span class="image-link">
<span
style="margin: 0 0 20px 0; display: inline-block; vertical-align: middle; width: 100%;"
>
<a
target="_blank"
href="https://pikwizard.com/photo/futuristic-transparent-screen-displaying-stock-market-data/567cdd755a14f989fec7cd08be3064de/"
style="text-decoration: none; font-size: 10px; margin: 0;"
>
<img src="https://pikwizard.com/pw/medium/567cdd755a14f989fec7cd08be3064de.jpg" style="margin: 0; width: 100%;" alt="" />
<p style="font-size: 12px; margin: 0;">PikWizard</p>
</a>
</span>
</span>
Free (free of charge)
Free for personal and commercial use.
Author: Creative Art
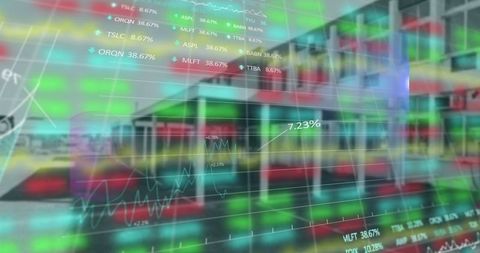
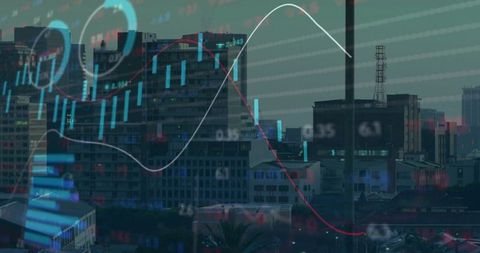
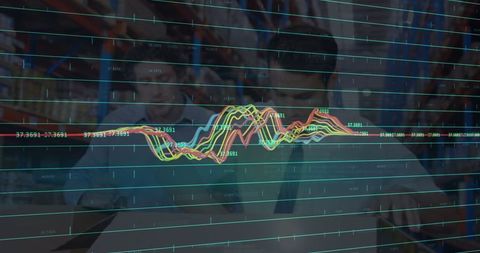
Similar Free Stock Images
Loading...

Premium


Premium


Premium


Premium

Premium


Premium


Premium


Premium


Premium


Premium


Premium


Premium


Premium


Premium

Premium

Premium

Premium


Premium

Premium


Premium


Premium


Premium

Premium

Premium

Premium