
- Home >
- Stock Photos >
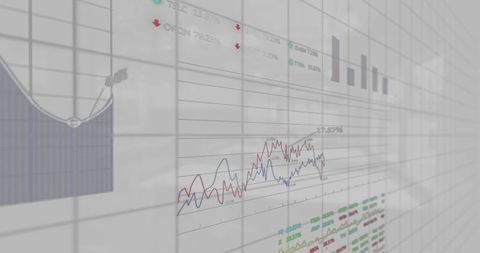
- Futuristic Virtual Stock Market Interface with Data Visualization
Futuristic Virtual Stock Market Interface with Data Visualization Image

This image depicts a dynamic digital interface showcasing fluctuating stock market data through complex graphs and numerical values. Abstract overlays give it a futuristic feel. Ideal for illustrating the concept of online trading platforms, digital finance technologies, and market analysis. Can enhance finance blogs, stock market articles, and educational materials focused on investment strategies and digital economy.
Powered by 


downloads
Tags:
More
Credit Photo
If you would like to credit the Photo, here are some ways you can do so
Text Link
photo Link
<span class="text-link">
<span>
<a target="_blank" href=https://pikwizard.com/photo/futuristic-virtual-stock-market-interface-with-data-visualization/48dd6f7442fb91e43d4ecae8006cde21/>PikWizard</a>
</span>
</span>
<span class="image-link">
<span
style="margin: 0 0 20px 0; display: inline-block; vertical-align: middle; width: 100%;"
>
<a
target="_blank"
href="https://pikwizard.com/photo/futuristic-virtual-stock-market-interface-with-data-visualization/48dd6f7442fb91e43d4ecae8006cde21/"
style="text-decoration: none; font-size: 10px; margin: 0;"
>
<img src="https://pikwizard.com/pw/medium/48dd6f7442fb91e43d4ecae8006cde21.jpg" style="margin: 0; width: 100%;" alt="" />
<p style="font-size: 12px; margin: 0;">PikWizard</p>
</a>
</span>
</span>
Free (free of charge)
Free for personal and commercial use.
Author: Awesome Content
Similar Free Stock Images

Premium


Premium


Premium


Premium


Premium


Premium


Premium


Premium


Premium


Premium


Premium

Premium


Premium

Premium

Premium


Premium


Premium


Premium

Premium


Premium


Premium

Premium


Premium


Premium


Premium


Explore More Free Stock Images