- Home >
- Stock Photos >
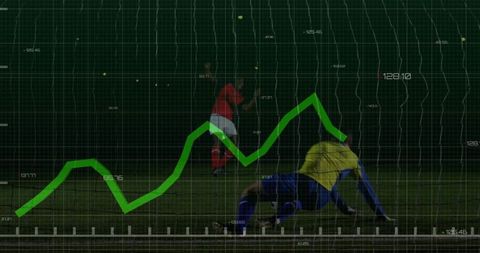
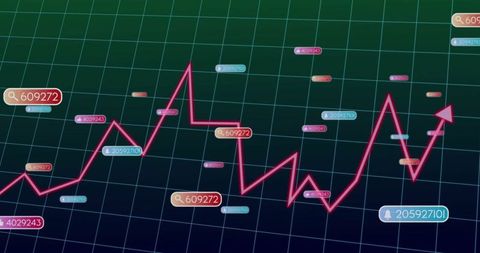
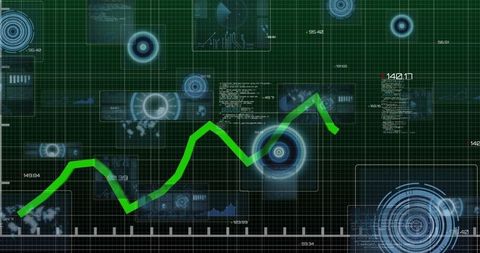
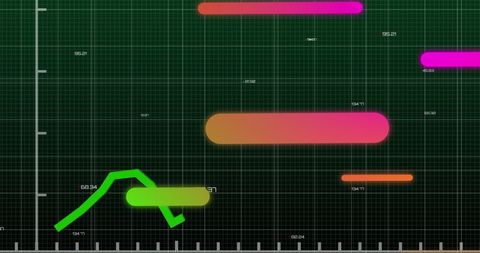
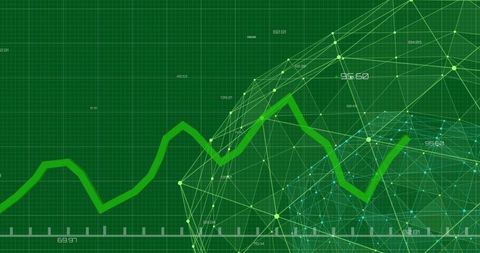
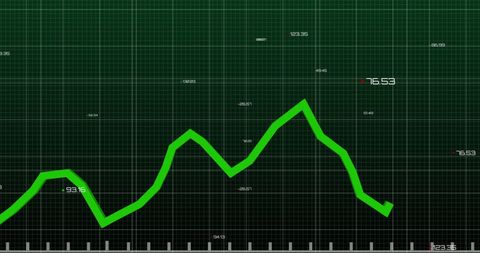
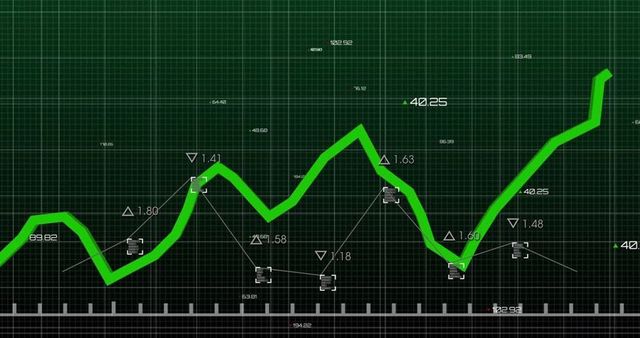
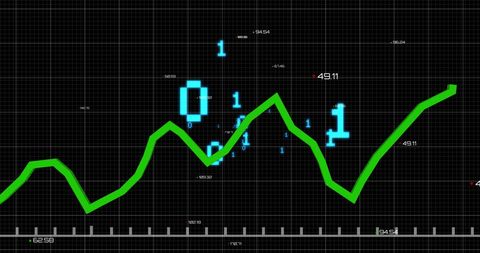
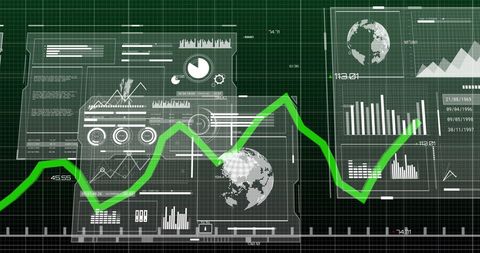
- Futuristic Zigzag Line Graph with Digital Data Labels
Futuristic Zigzag Line Graph with Digital Data Labels Image
Neon green line graph animating across a digital dashboard filled with numerical data labels, offering an advanced visualization experience for those engaging with data-driven projects. Ideal for use in marketing materials, finance presentations, technology trend decks, or educational demonstrations related to data analytics and technology advancements.

downloads
Tags:
More
Credit Photo
If you would like to credit the Photo, here are some ways you can do so
Text Link
photo Link
<span class="text-link">
<span>
<a target="_blank" href=https://pikwizard.com/photo/futuristic-zigzag-line-graph-with-digital-data-labels/65a3021aa30b27dd3136f4195e832304/>PikWizard</a>
</span>
</span>
<span class="image-link">
<span
style="margin: 0 0 20px 0; display: inline-block; vertical-align: middle; width: 100%;"
>
<a
target="_blank"
href="https://pikwizard.com/photo/futuristic-zigzag-line-graph-with-digital-data-labels/65a3021aa30b27dd3136f4195e832304/"
style="text-decoration: none; font-size: 10px; margin: 0;"
>
<img src="https://pikwizard.com/pw/medium/65a3021aa30b27dd3136f4195e832304.jpg" style="margin: 0; width: 100%;" alt="" />
<p style="font-size: 12px; margin: 0;">PikWizard</p>
</a>
</span>
</span>
Free (free of charge)
Free for personal and commercial use.
Author: People Creations