
- Home >
- Stock Photos >
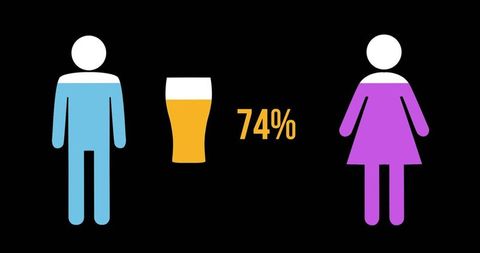
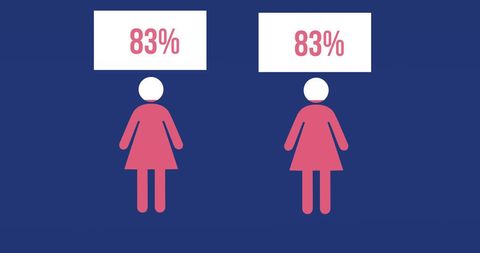
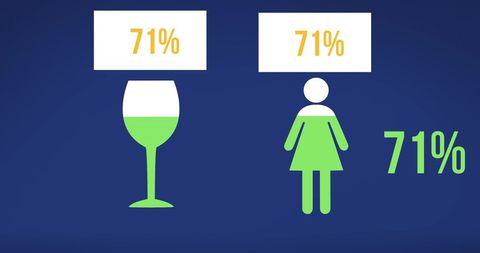
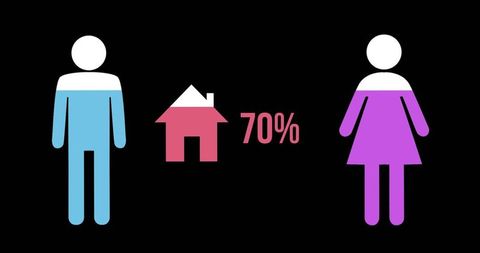
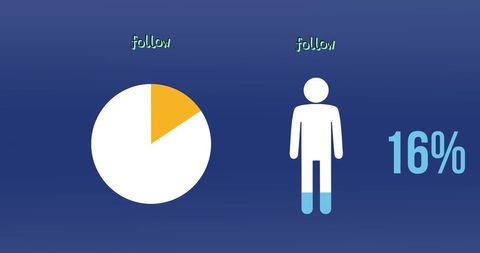
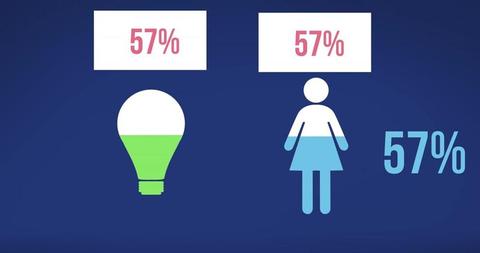
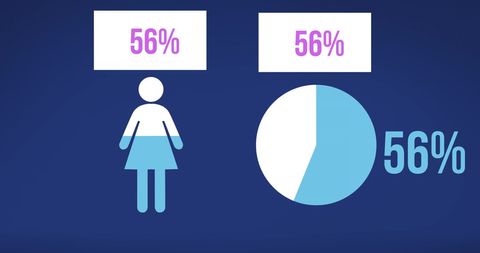
- Gender Representation in Data Visualization Concept
Gender Representation in Data Visualization Concept Image

Colorful conceptual illustration representing gender demographics using simple shapes and color coding. Minimalistic design indicates percentage distribution between male and female figures through an abstract pie chart. Useful for articles about gender studies, demographic analysis, educational content on data interpretation, or presentations on diversity in data science.
Powered by  - Get 15% off with code: PIKWIZARD15


downloads
Tags:
More
Credit Photo
If you would like to credit the Photo, here are some ways you can do so
Text Link
photo Link
<span class="text-link">
<span>
<a target="_blank" href=https://pikwizard.com/photo/gender-representation-in-data-visualization-concept/e5eefb70a2b01b62ac5cec55ae2b7407/>PikWizard</a>
</span>
</span>
<span class="image-link">
<span
style="margin: 0 0 20px 0; display: inline-block; vertical-align: middle; width: 100%;"
>
<a
target="_blank"
href="https://pikwizard.com/photo/gender-representation-in-data-visualization-concept/e5eefb70a2b01b62ac5cec55ae2b7407/"
style="text-decoration: none; font-size: 10px; margin: 0;"
>
<img src="https://pikwizard.com/pw/medium/e5eefb70a2b01b62ac5cec55ae2b7407.jpg" style="margin: 0; width: 100%;" alt="" />
<p style="font-size: 12px; margin: 0;">PikWizard</p>
</a>
</span>
</span>
Free (free of charge)
Free for personal and commercial use.
Author: Creative Art
Similar Free Stock Images

Premium


Premium


Premium


Premium

Premium


Premium


Premium


Premium


Premium


Premium


Premium


Premium

Premium

Premium


Premium


Premium


Premium

Premium

Premium


Premium


Premium


Premium


Premium


Premium

Premium


Explore More Free Stock Images