- Home >
- Stock Photos >
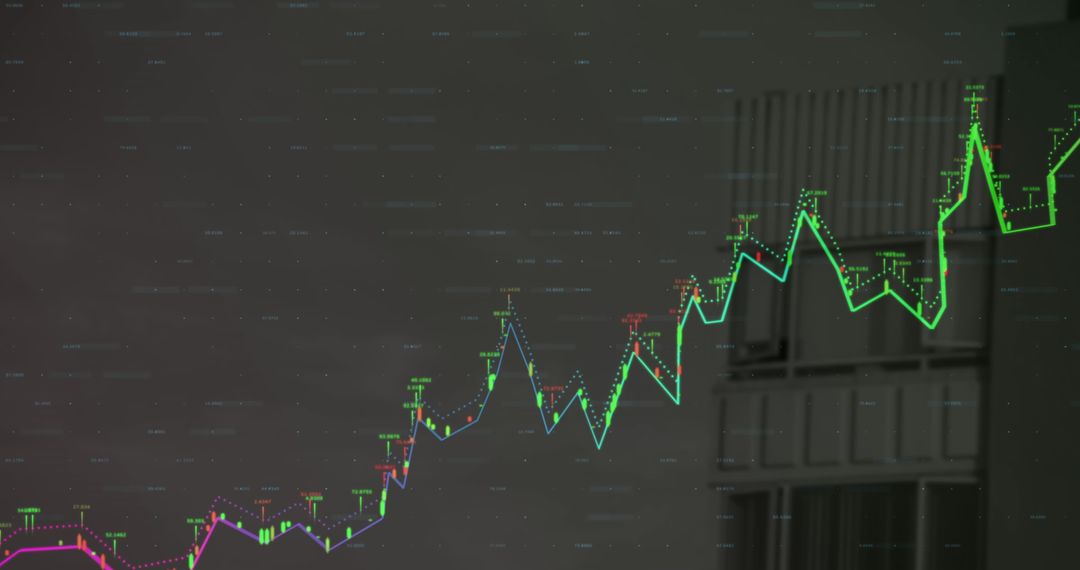
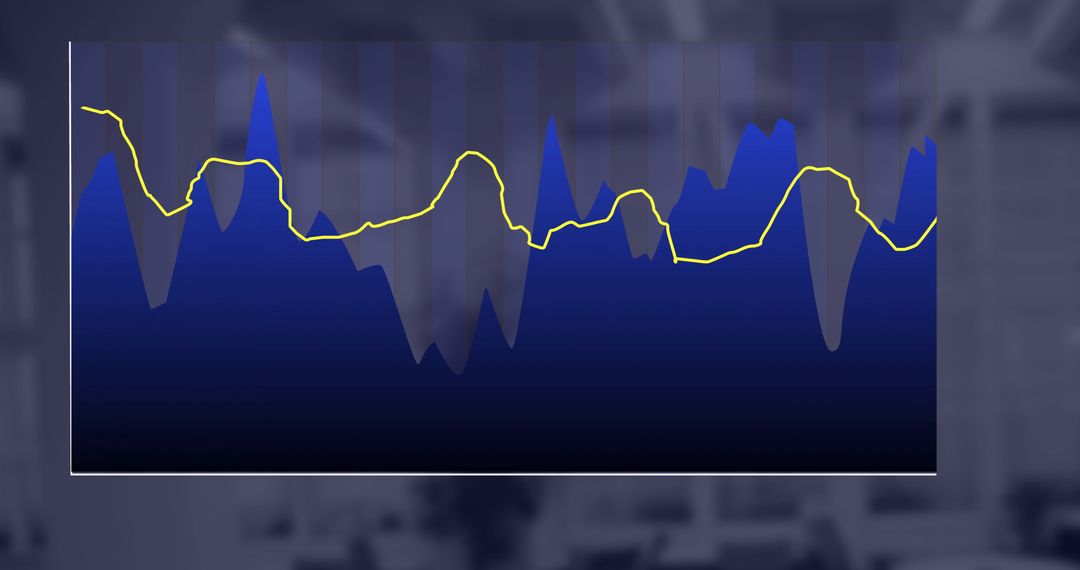
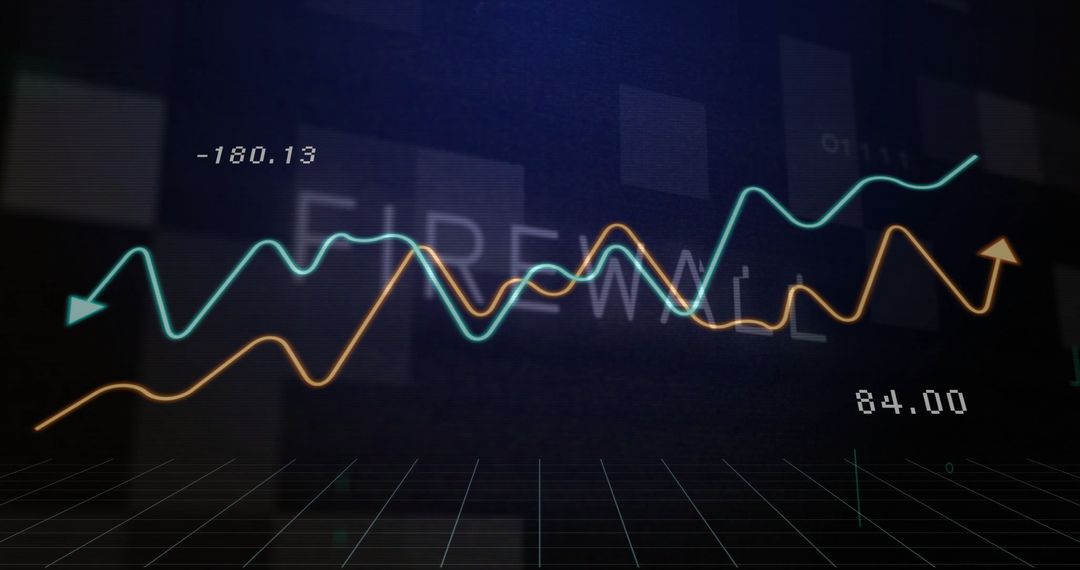
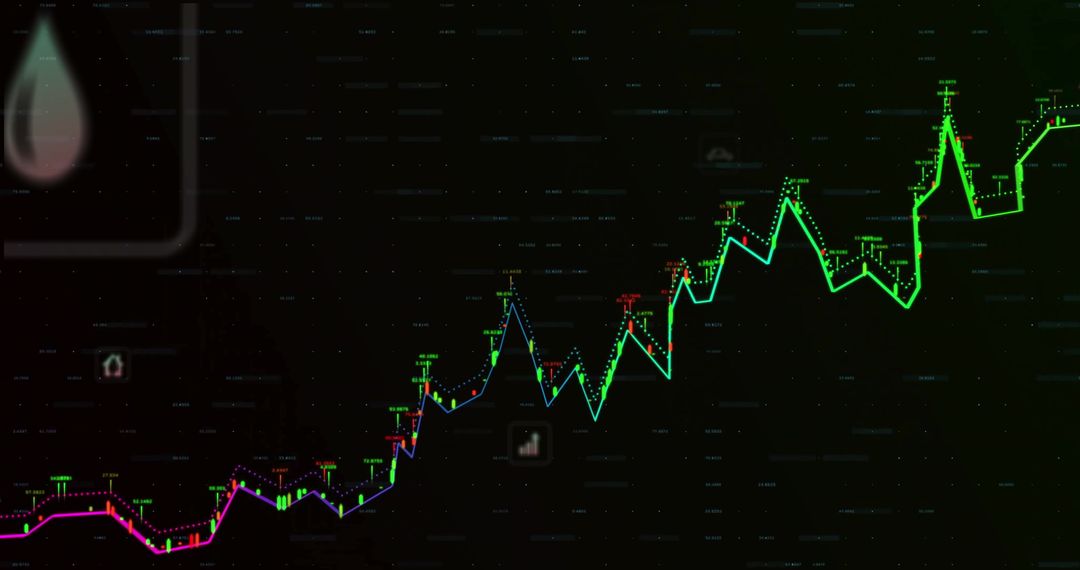
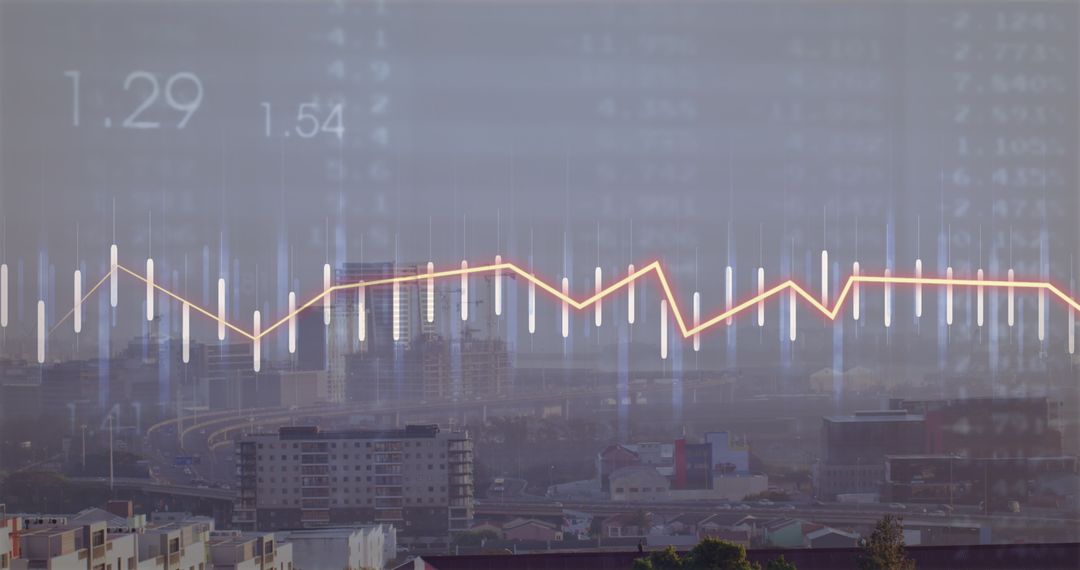
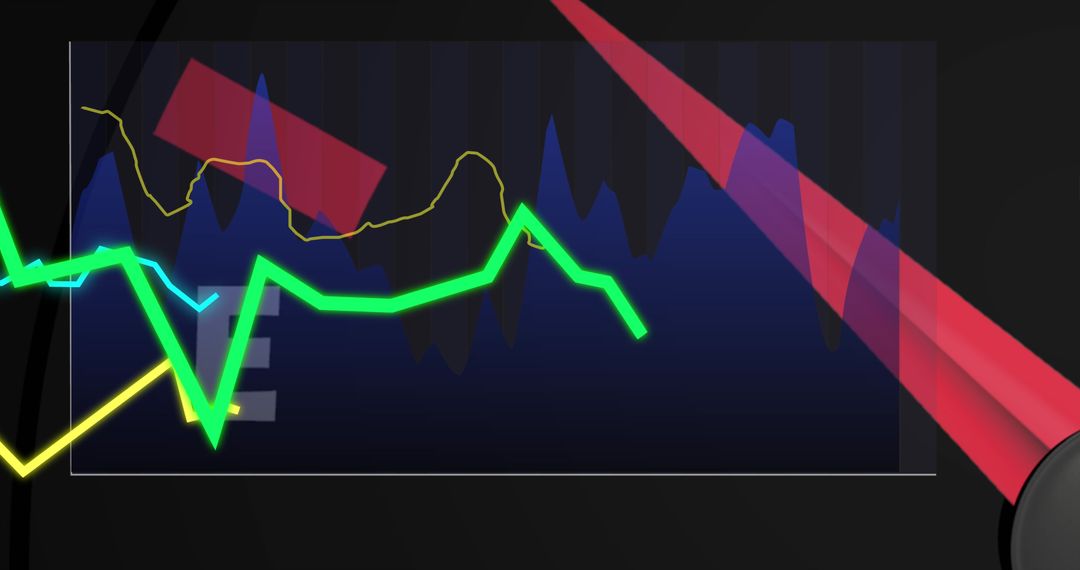
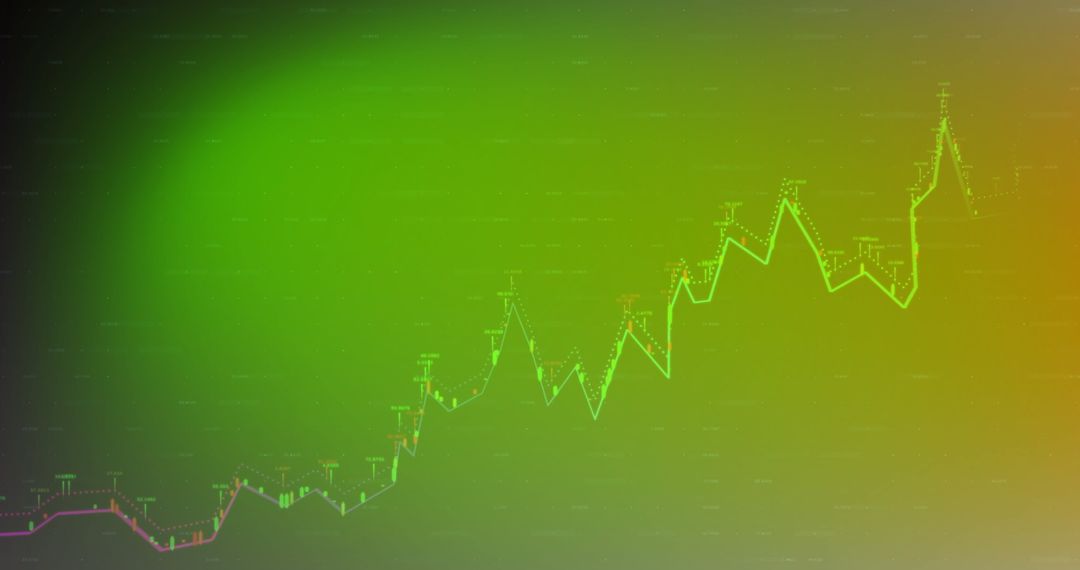
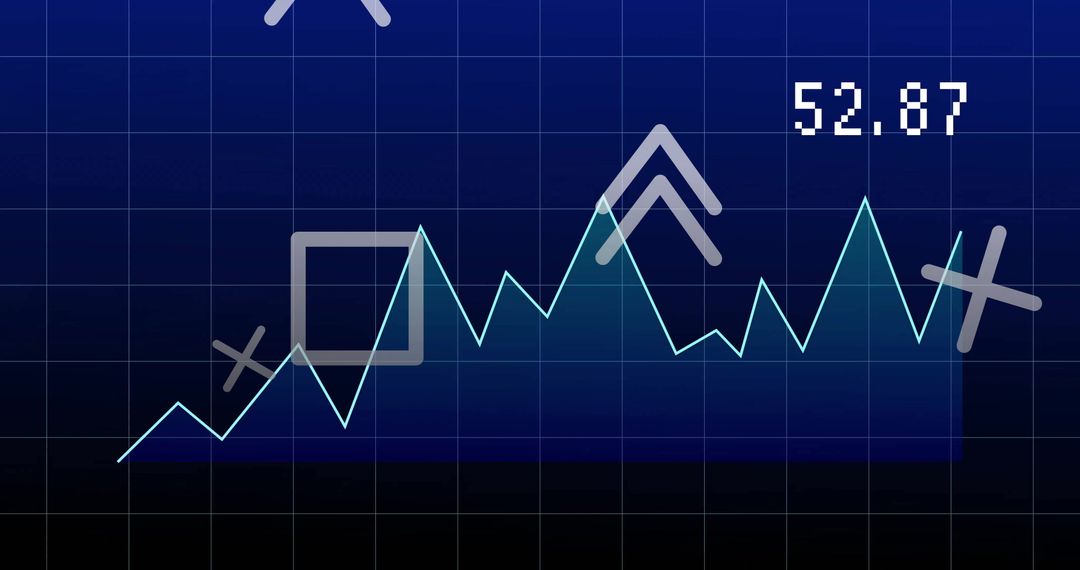
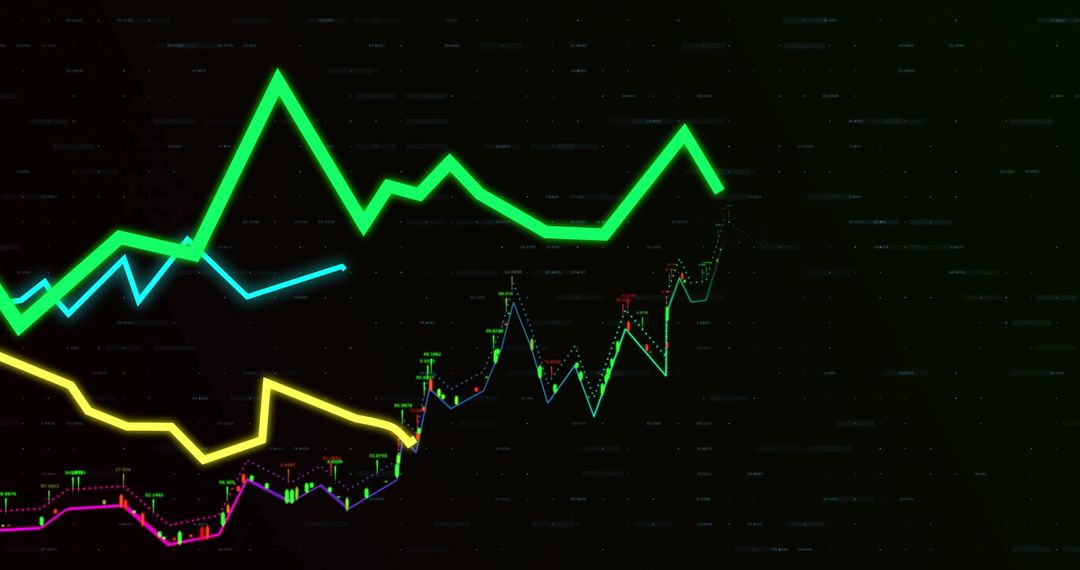
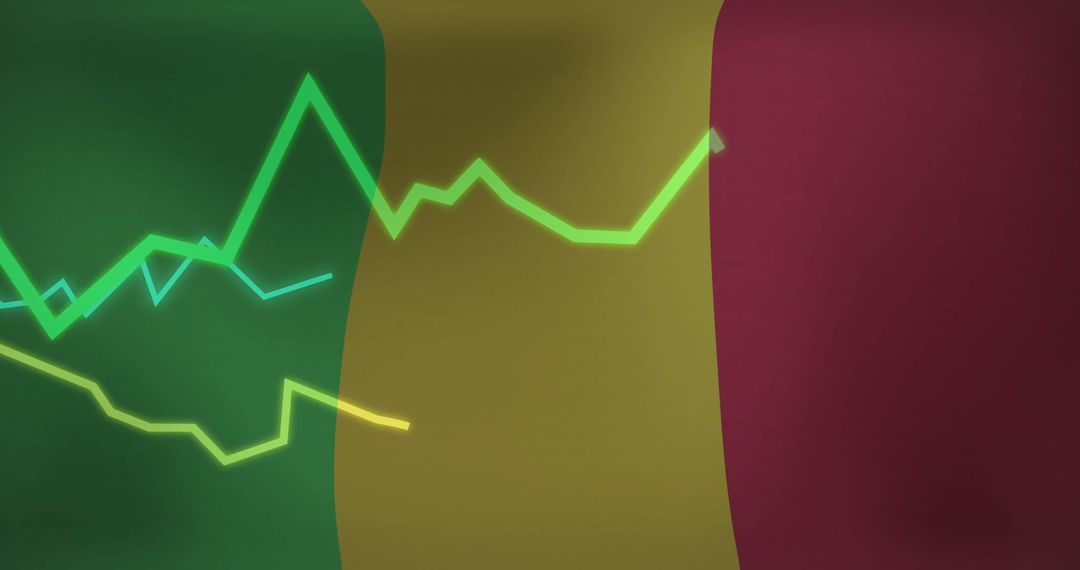
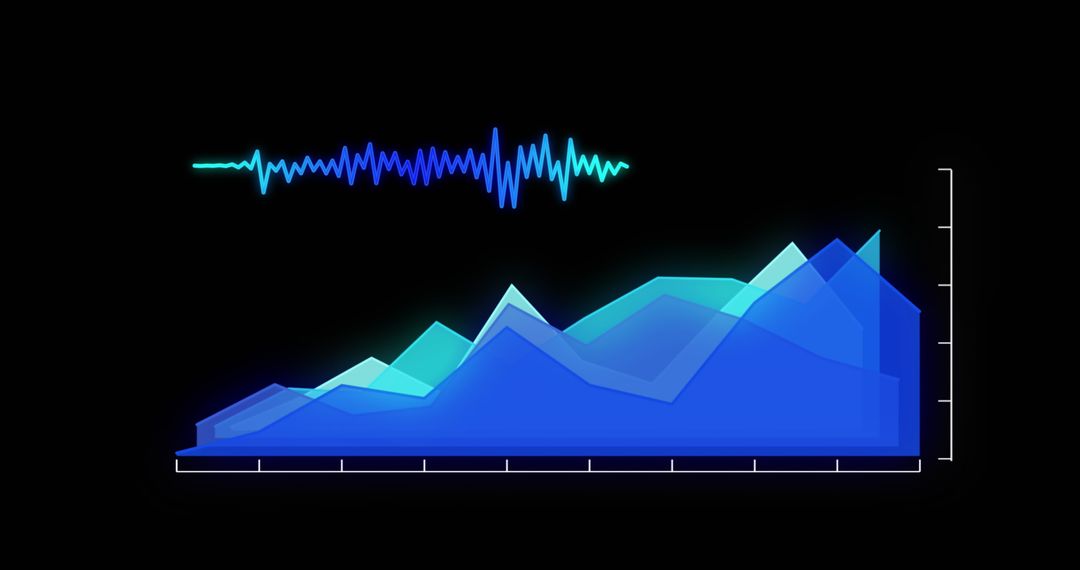
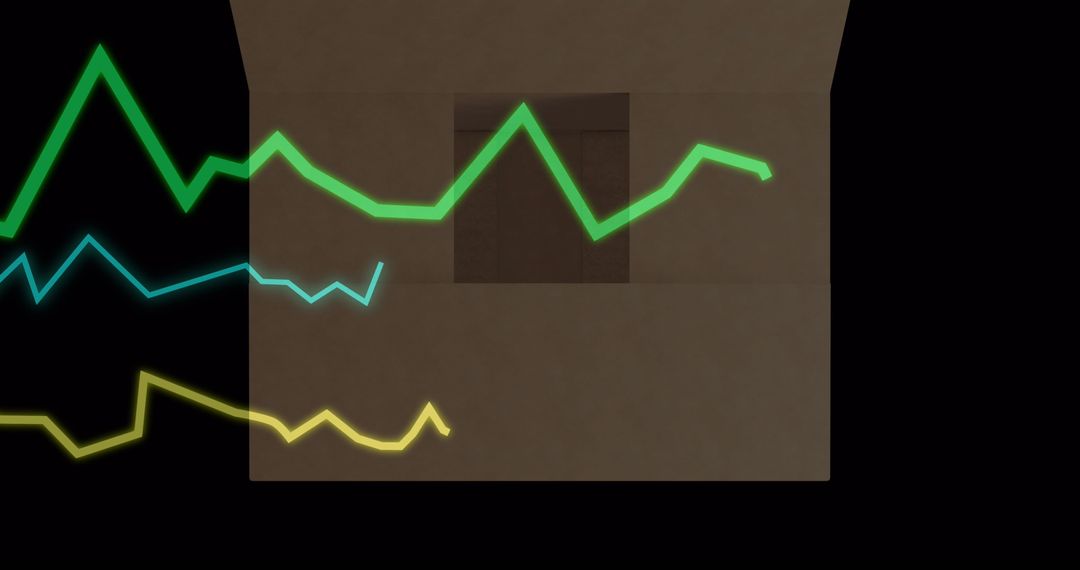
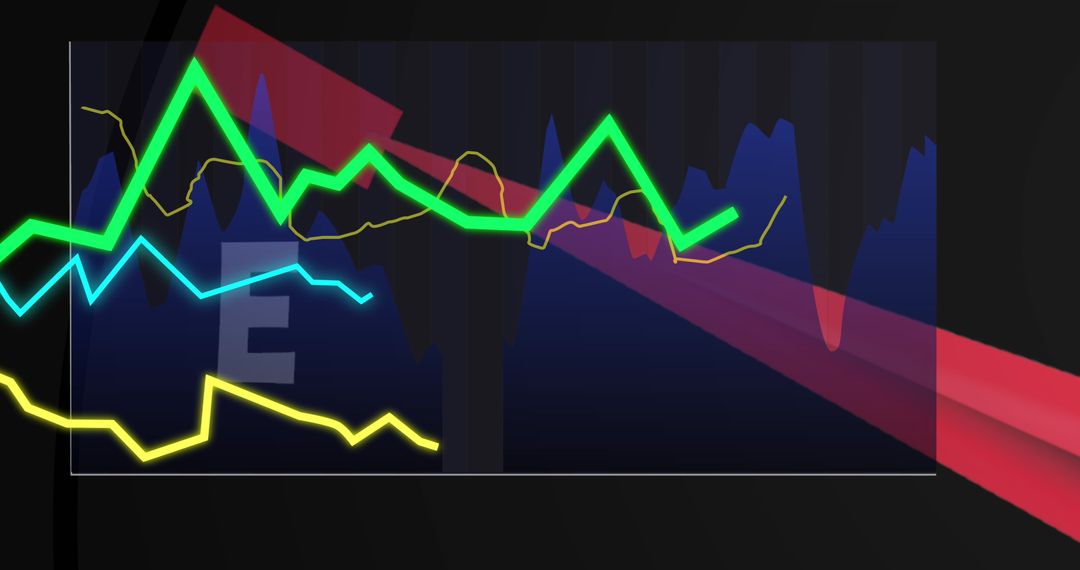
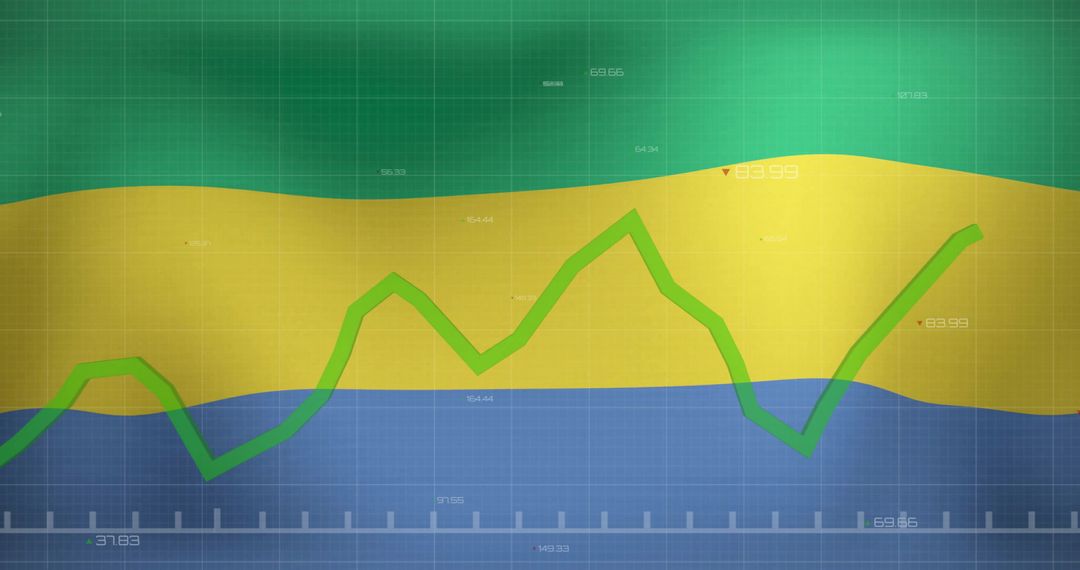
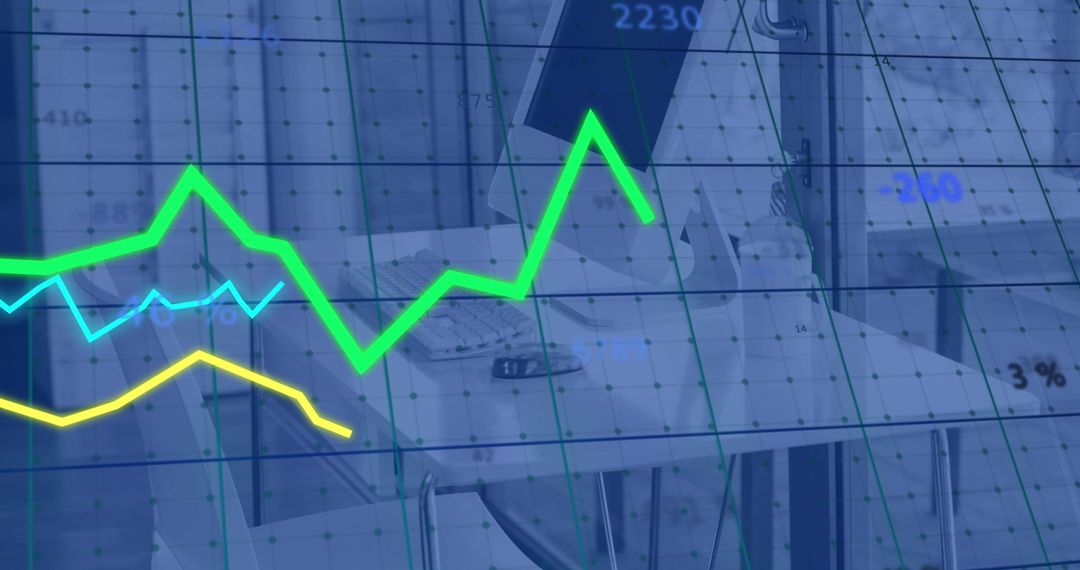
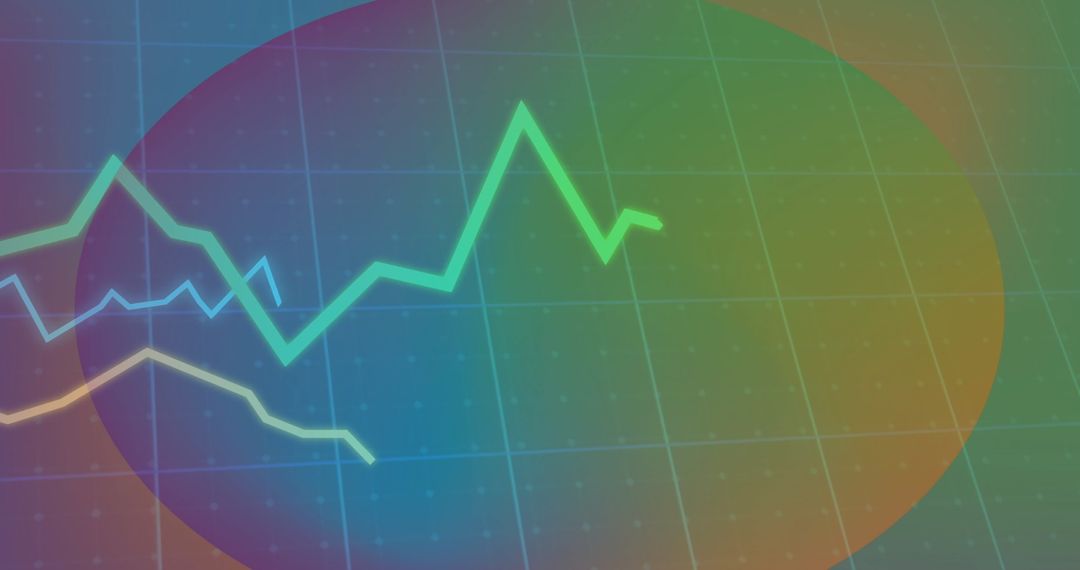
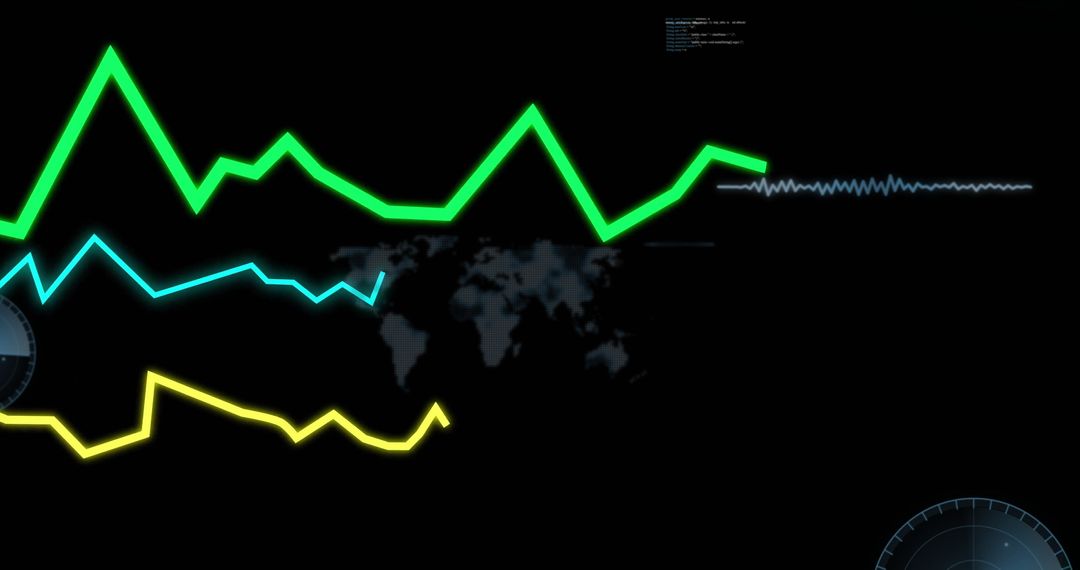
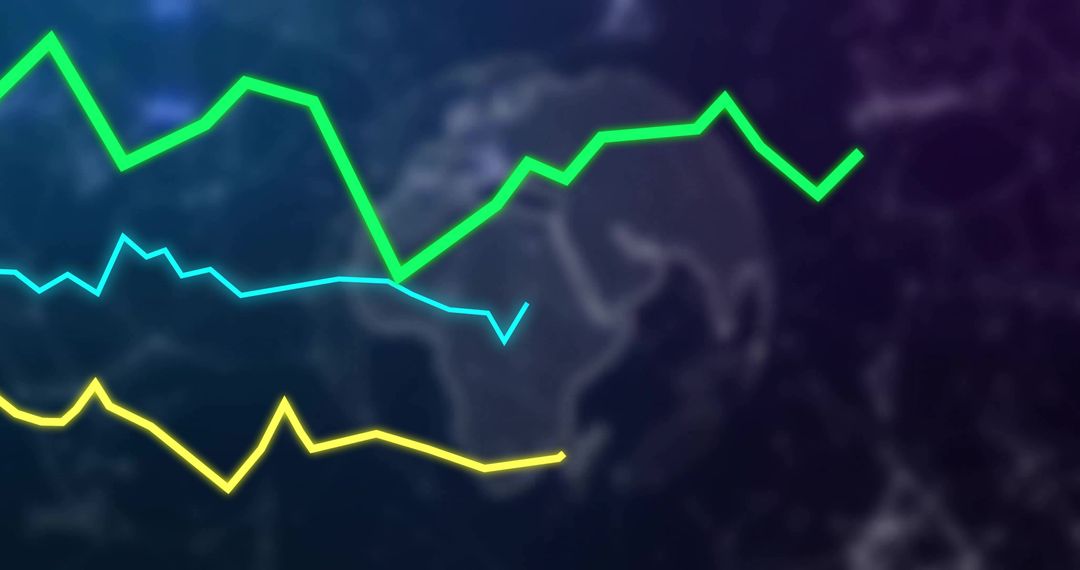
- Geopolitical Impact Analysis with Ukrainian and NATO Imagery
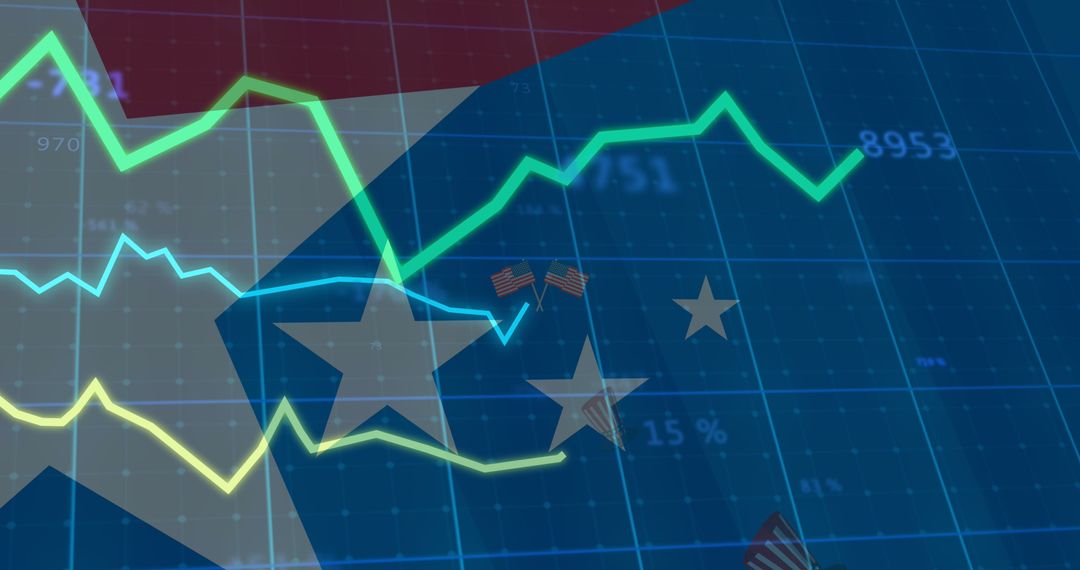
Geopolitical Impact Analysis with Ukrainian and NATO Imagery Image
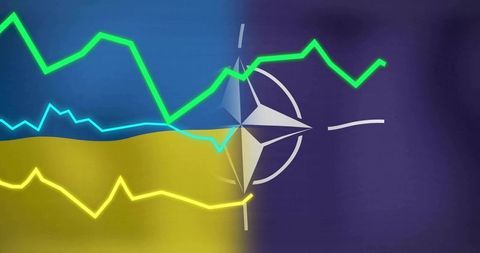
Illustrates cooperation between Ukraine and NATO within context of fluctuating line graphs. Perfect for articles or presentations discussing international alliances, geopolitical strategies, or economic impacts involving these regions. Supports educational materials that explore data about global interactions or cooperation metrics.
Powered by  - Get 15% off with code: PIKWIZARD15


0
downloads
downloads
Tags:
More
Credit Photo
If you would like to credit the Photo, here are some ways you can do so
Text Link
photo Link
<span class="text-link">
<span>
<a target="_blank" href=https://pikwizard.com/photo/geopolitical-impact-analysis-with-ukrainian-and-nato-imagery/e48549b46de54c17f6b285a10f4ac5b7/>PikWizard</a>
</span>
</span>
<span class="image-link">
<span
style="margin: 0 0 20px 0; display: inline-block; vertical-align: middle; width: 100%;"
>
<a
target="_blank"
href="https://pikwizard.com/photo/geopolitical-impact-analysis-with-ukrainian-and-nato-imagery/e48549b46de54c17f6b285a10f4ac5b7/"
style="text-decoration: none; font-size: 10px; margin: 0;"
>
<img src="https://pikwizard.com/pw/medium/e48549b46de54c17f6b285a10f4ac5b7.jpg" style="margin: 0; width: 100%;" alt="" />
<p style="font-size: 12px; margin: 0;">PikWizard</p>
</a>
</span>
</span>
Free (free of charge)
Free for personal and commercial use.
Author: Creative Art
Similar Free Stock Images