- Home >
- Stock Photos >
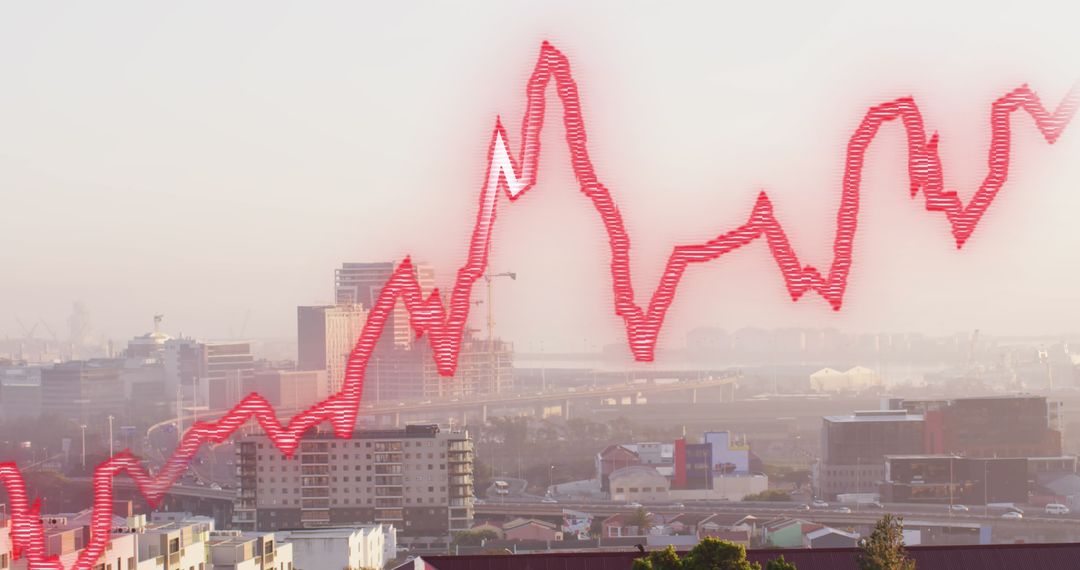
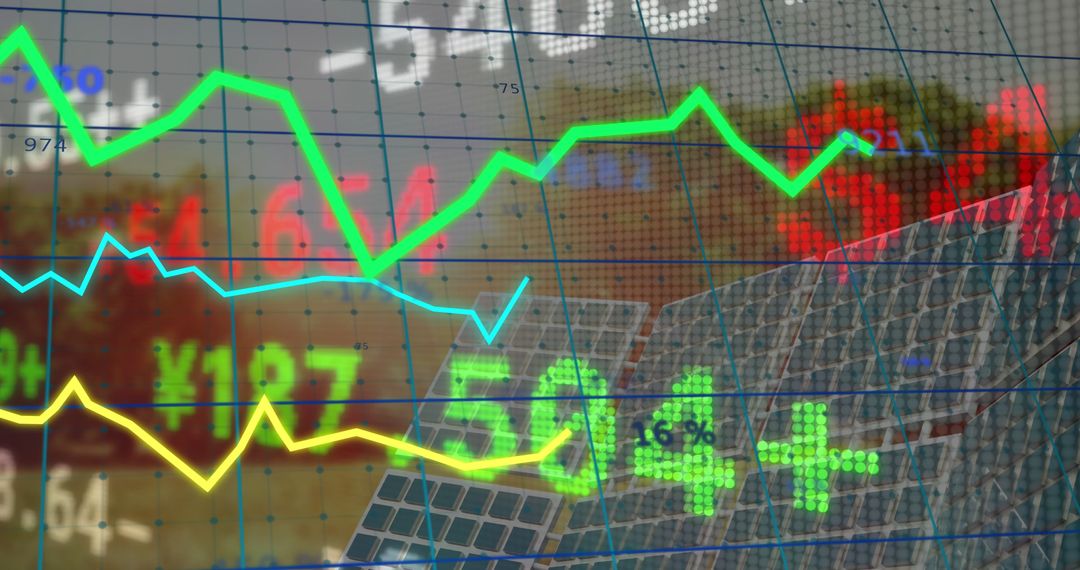
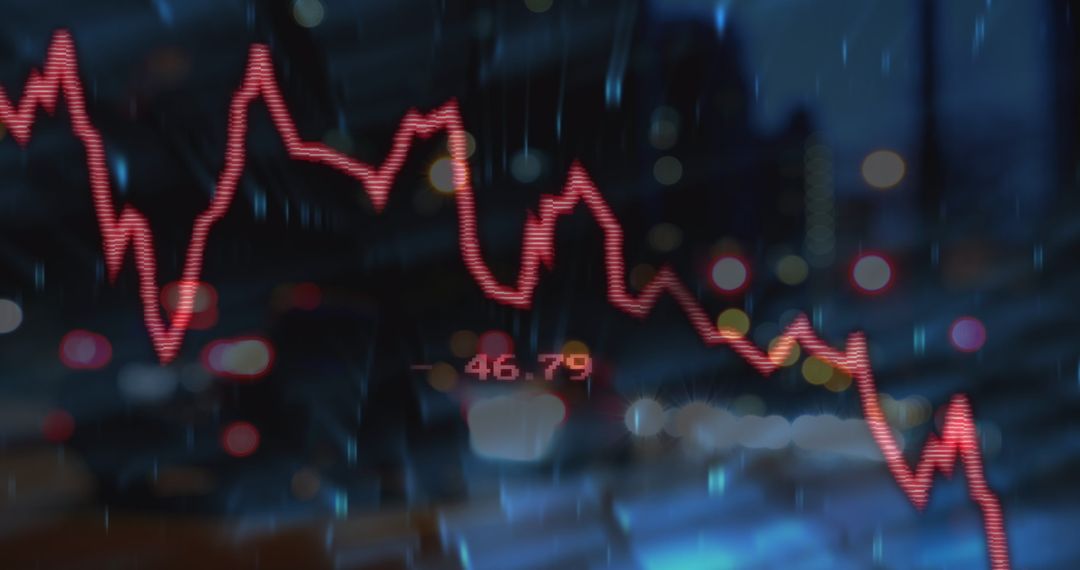
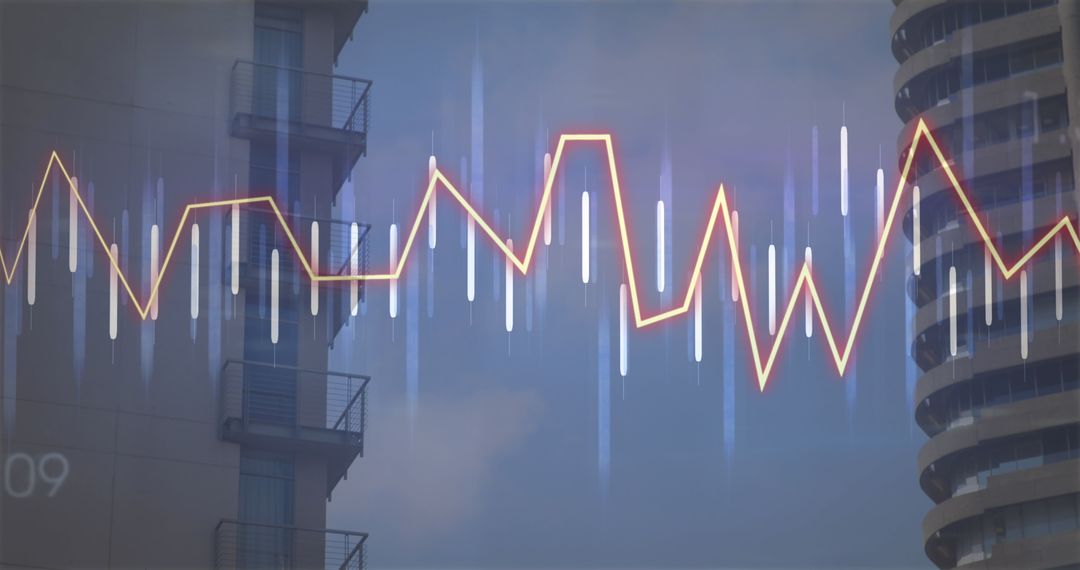
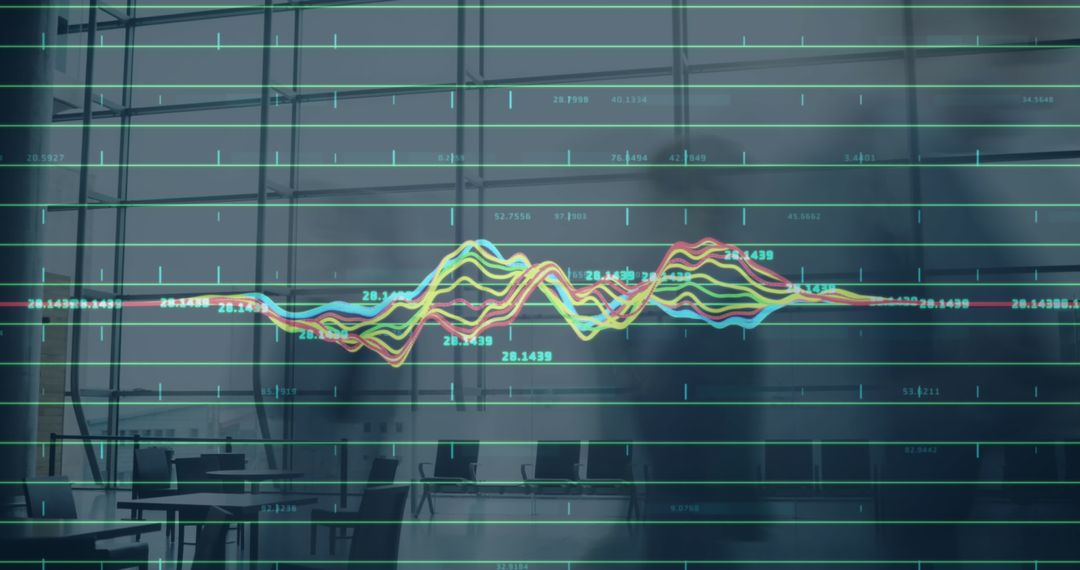
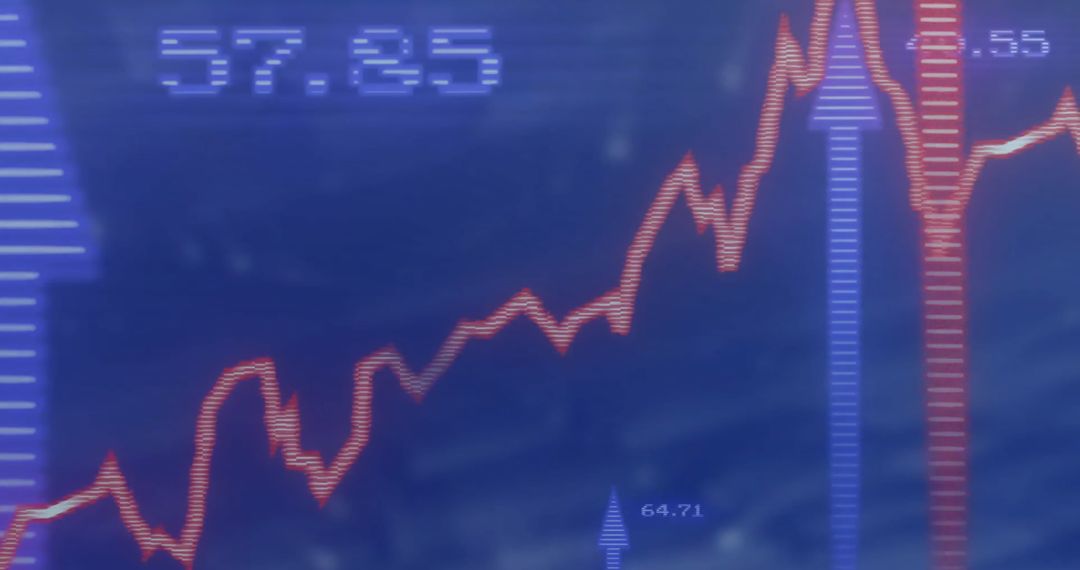
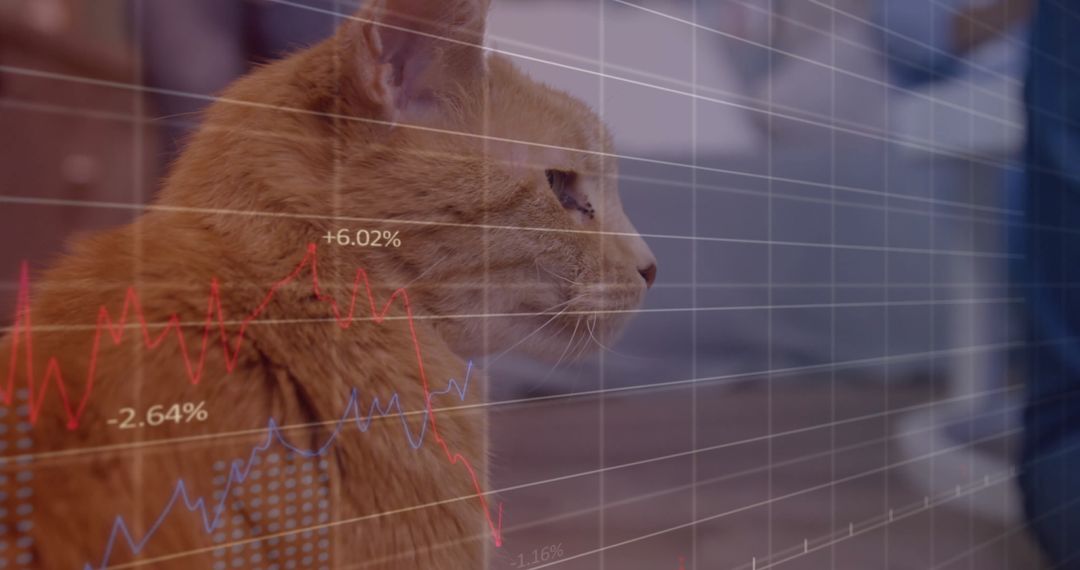
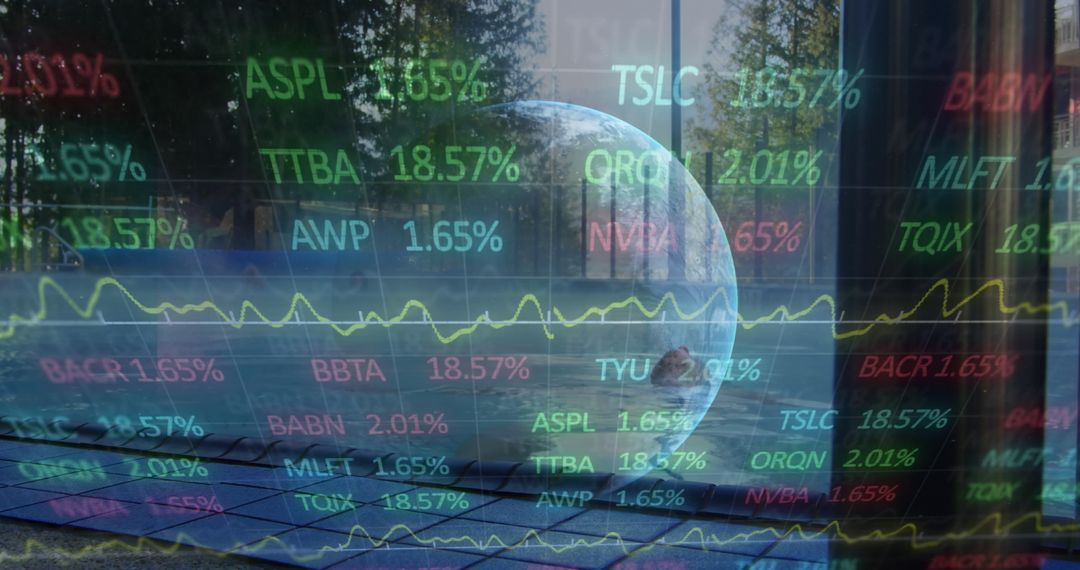
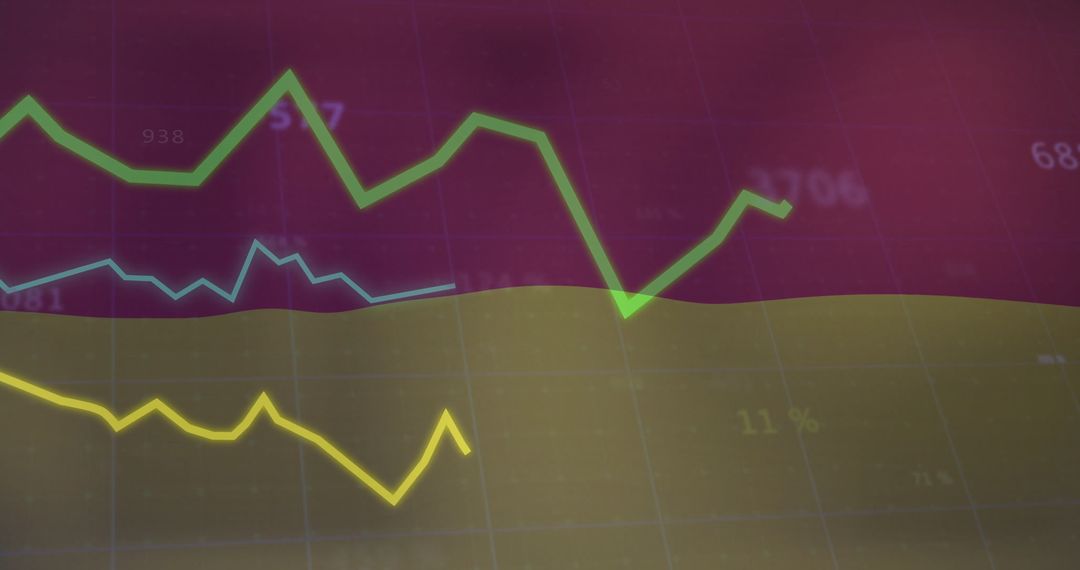
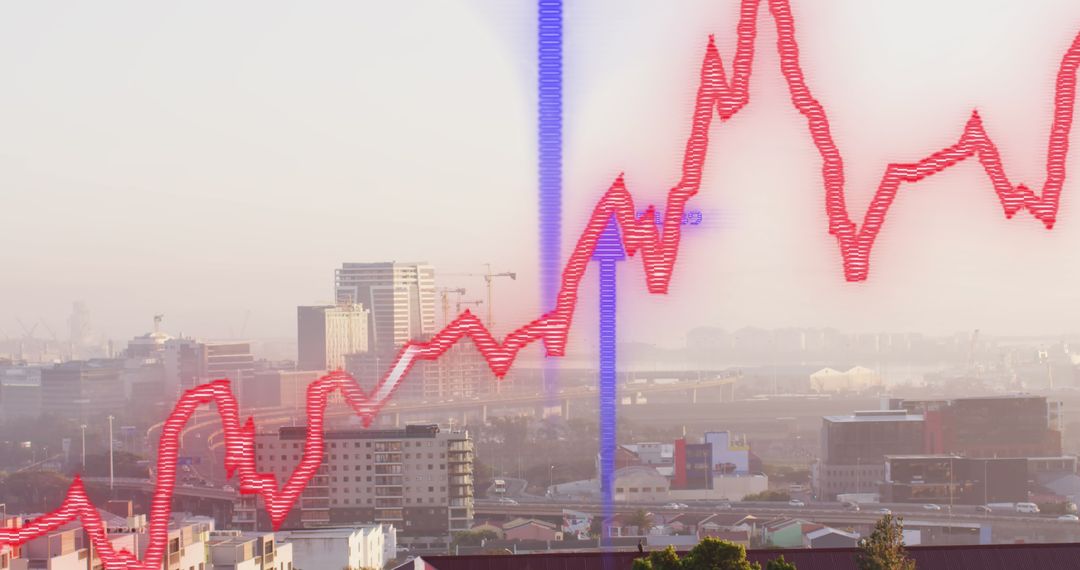
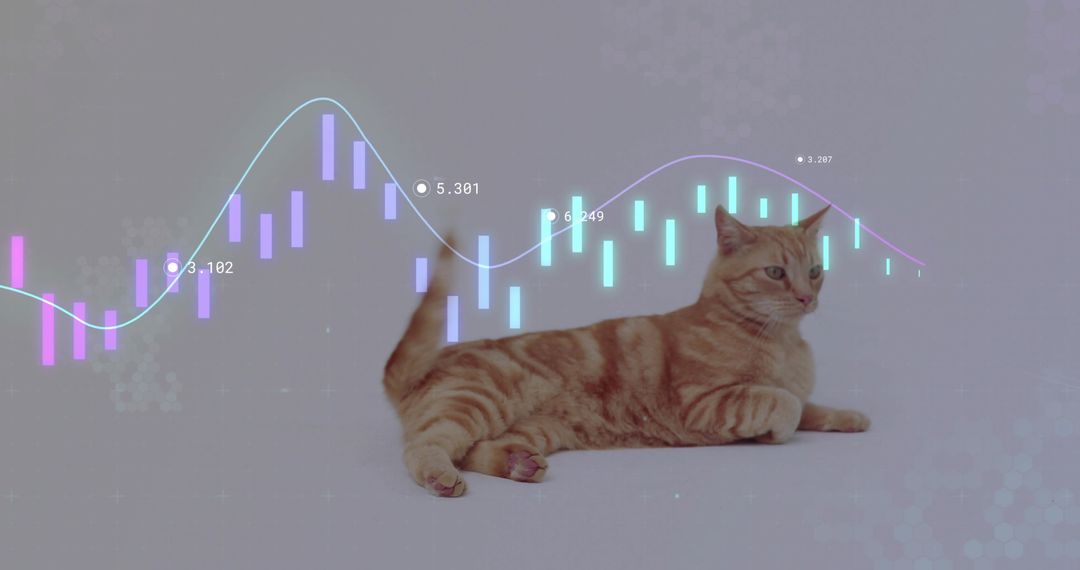
- Ginger Cat Observing Red Line Graph on Floor Overlay
Ginger Cat Observing Red Line Graph on Floor Overlay Image
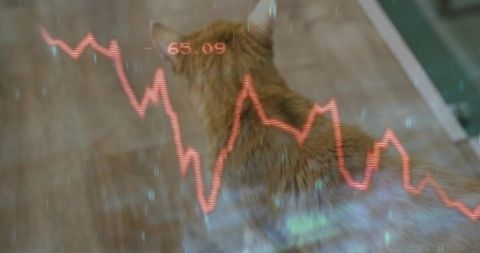
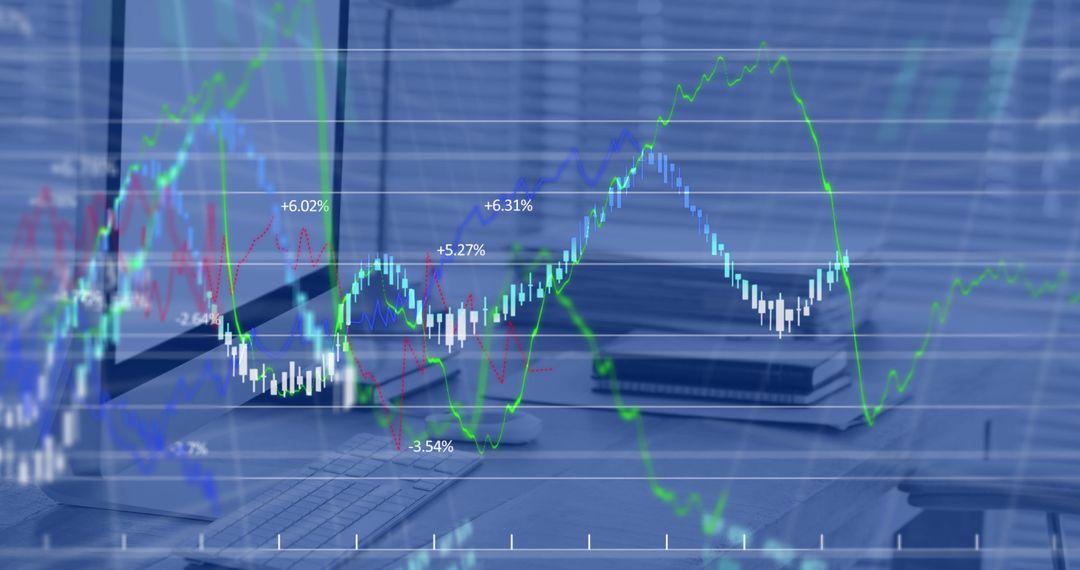
Ginger cat is intently observing a fluctuating red line graph, symbolizing data analytics and stock market fluctuations. This combination of pet features with technological elements creates a compelling visual ideal for illustrating concepts of market trends and analytics. Perfect for use in financial consulting context, or as symbolic depiction of monitoring economic performance.
Powered by 


0
downloads
downloads
Tags:
More
Credit Photo
If you would like to credit the Photo, here are some ways you can do so
Text Link
photo Link
<span class="text-link">
<span>
<a target="_blank" href=https://pikwizard.com/photo/ginger-cat-observing-red-line-graph-on-floor-overlay/57c345024be583c992b9885eb208d91b/>PikWizard</a>
</span>
</span>
<span class="image-link">
<span
style="margin: 0 0 20px 0; display: inline-block; vertical-align: middle; width: 100%;"
>
<a
target="_blank"
href="https://pikwizard.com/photo/ginger-cat-observing-red-line-graph-on-floor-overlay/57c345024be583c992b9885eb208d91b/"
style="text-decoration: none; font-size: 10px; margin: 0;"
>
<img src="https://pikwizard.com/pw/medium/57c345024be583c992b9885eb208d91b.jpg" style="margin: 0; width: 100%;" alt="" />
<p style="font-size: 12px; margin: 0;">PikWizard</p>
</a>
</span>
</span>
Free (free of charge)
Free for personal and commercial use.
Author: Creative Art
Similar Free Stock Images