- Home >
- Stock Photos >
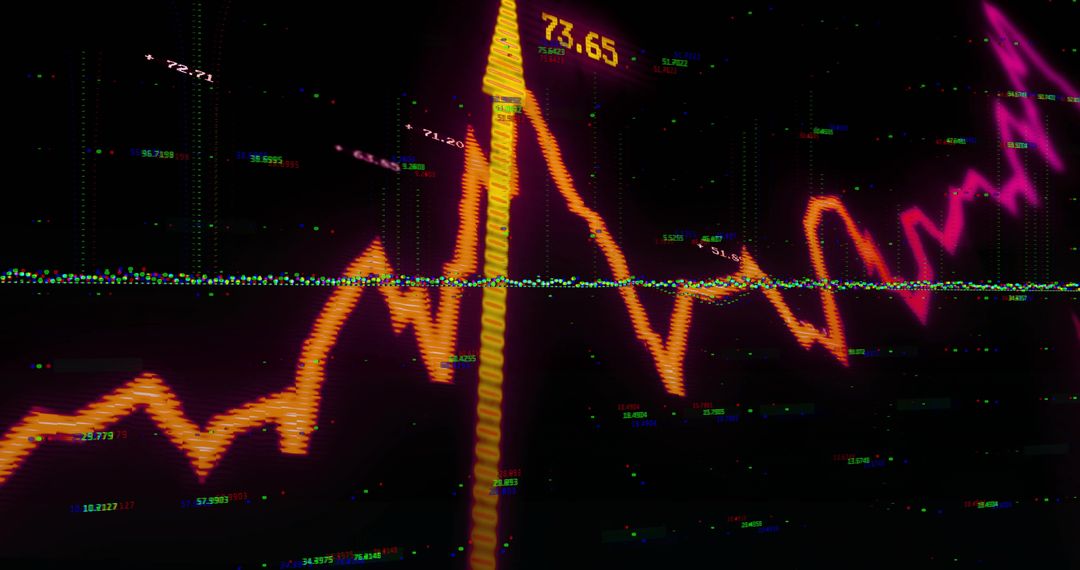
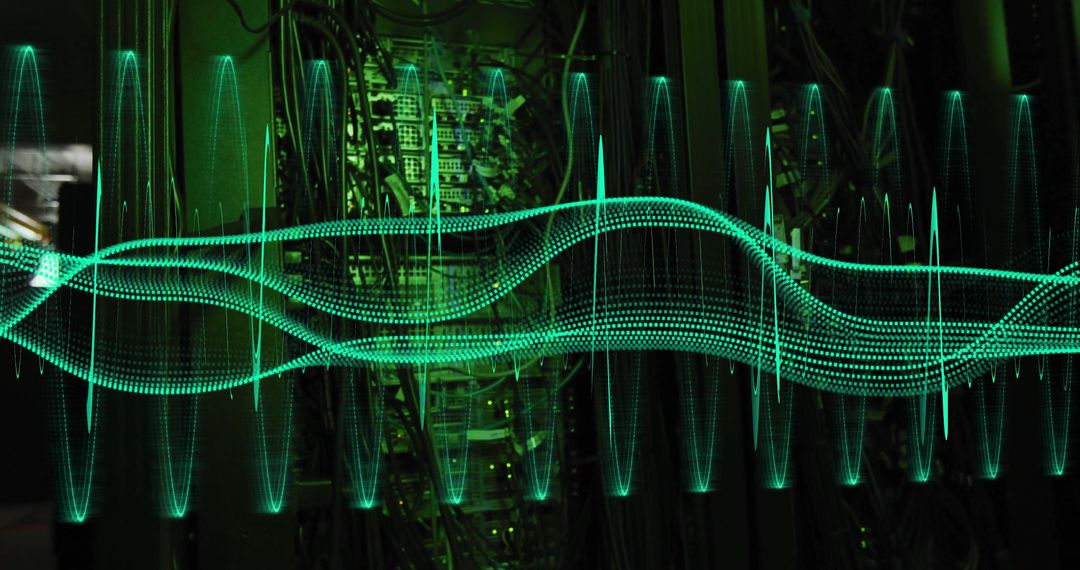
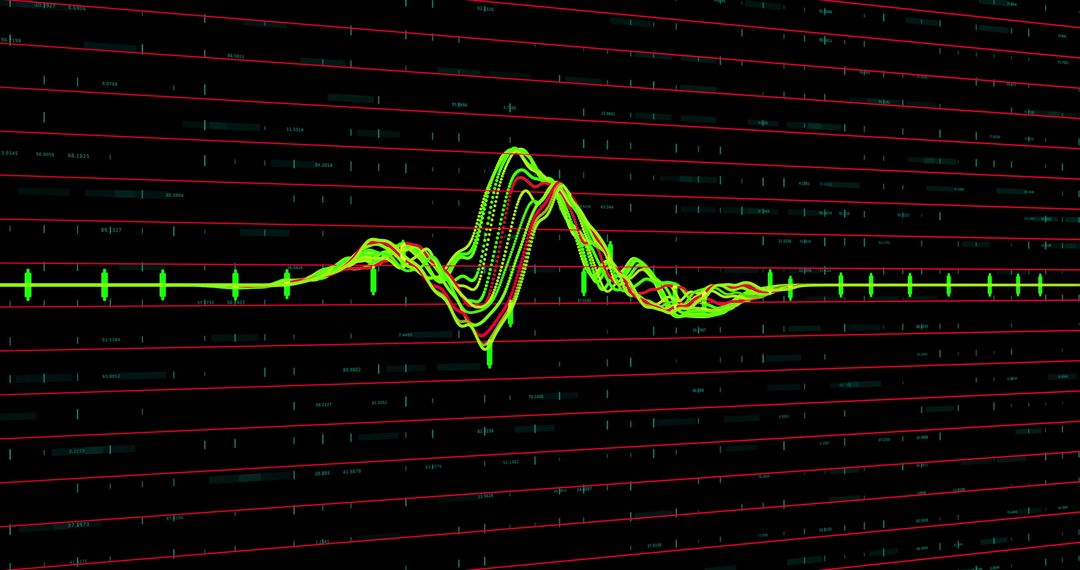
- Glitched stock market chart overlaying currency note, displaying volatility and digital data
Glitched stock market chart overlaying currency note, displaying volatility and digital data Image

Green-tinted banknote background with yellow jagged stock chart running across screen and horizontal glitch band, creating high-tech financial data feel. Visual elements include trend line spikes, numeric tickers, pixel noise and layered digital overlay, conveying market volatility and rapid price movement. Perfect for financial news graphics, market analysis presentations, fintech websites, trading platform banners, investment reports and economic articles. Useful for illustrating market volatility, algorithmic trading, forex fluctuation, risk management, data analytics and digital currency themes. Customization ideas: adjusting color palette to match brand, animating chart for video intro, cropping for header artwork, adding headline text or logo overlay.
Powered by 


0
downloads
downloads
Tags:
More
Credit Photo
If you would like to credit the Photo, here are some ways you can do so
Text Link
photo Link
<span class="text-link">
<span>
<a target="_blank" href=https://pikwizard.com/photo/glitched-stock-market-chart-overlaying-currency-note-displaying-volatility-and-digital-data/30d2041f3319a8bcc63127c6332b05e8/>PikWizard</a>
</span>
</span>
<span class="image-link">
<span
style="margin: 0 0 20px 0; display: inline-block; vertical-align: middle; width: 100%;"
>
<a
target="_blank"
href="https://pikwizard.com/photo/glitched-stock-market-chart-overlaying-currency-note-displaying-volatility-and-digital-data/30d2041f3319a8bcc63127c6332b05e8/"
style="text-decoration: none; font-size: 10px; margin: 0;"
>
<img src="https://pikwizard.com/pw/medium/30d2041f3319a8bcc63127c6332b05e8.jpg" style="margin: 0; width: 100%;" alt="" />
<p style="font-size: 12px; margin: 0;">PikWizard</p>
</a>
</span>
</span>
Free (free of charge)
Free for personal and commercial use.
Author: People Creations
Similar Free Stock Images

Premium


Premium


Premium


Premium


Premium


Premium


Premium


Premium


Premium


Premium


Premium


Premium


Premium


Premium


Premium


Premium


Premium


Premium


Premium


Premium


Premium


Premium


Premium


Premium