- Home >
- Stock Photos >
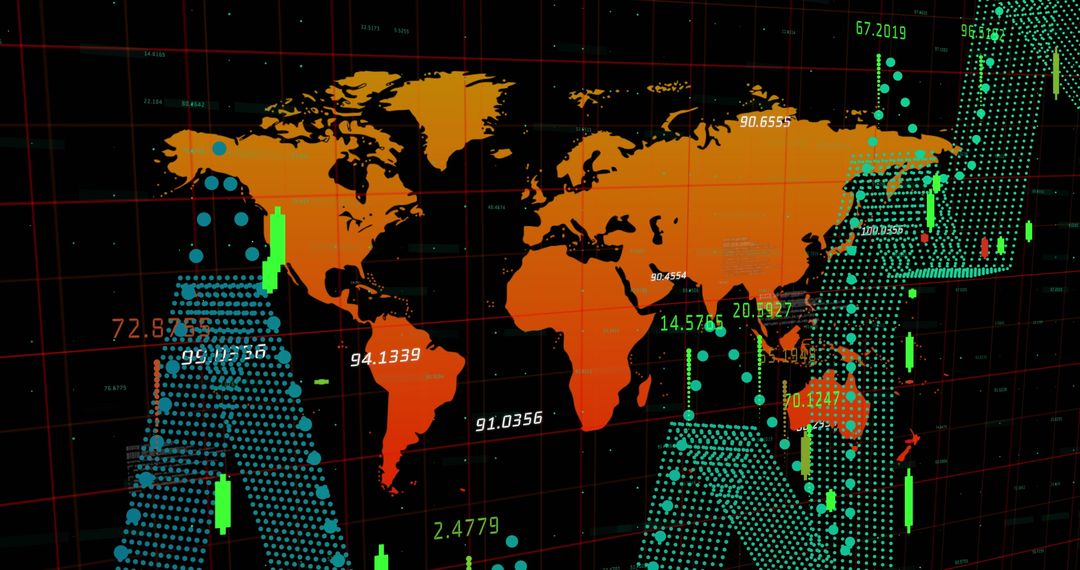
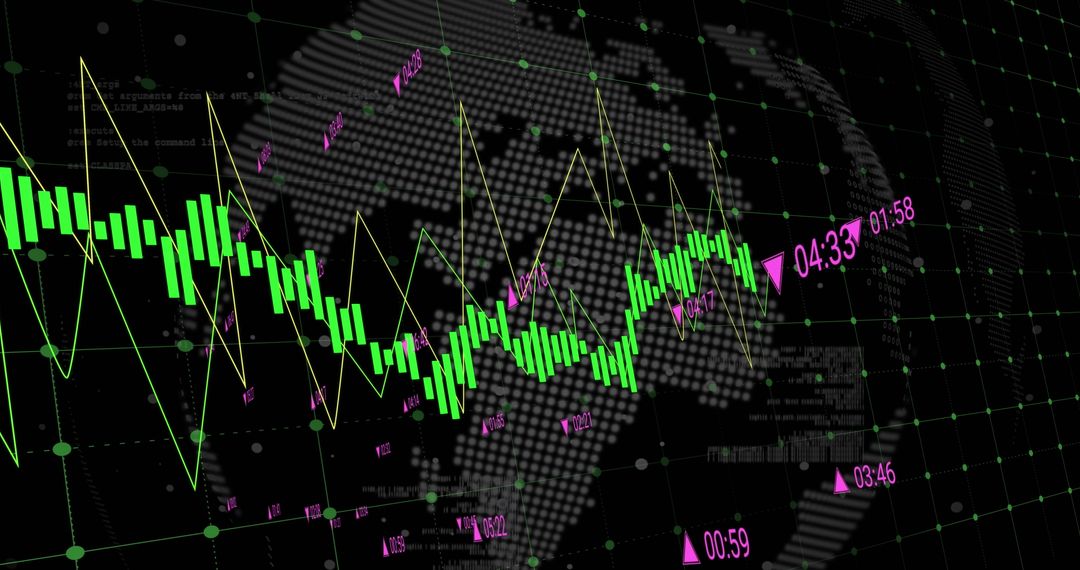
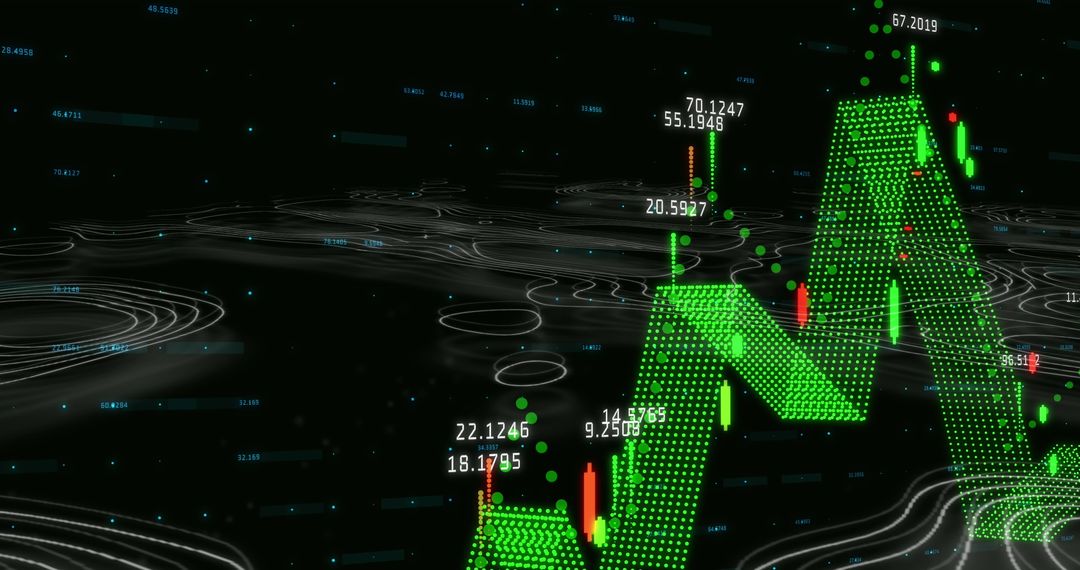
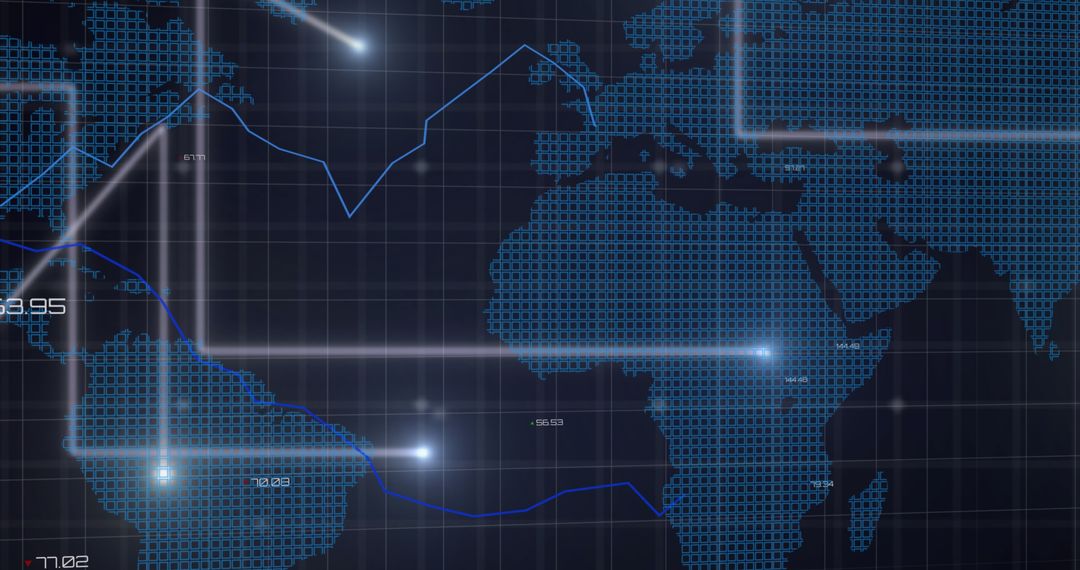
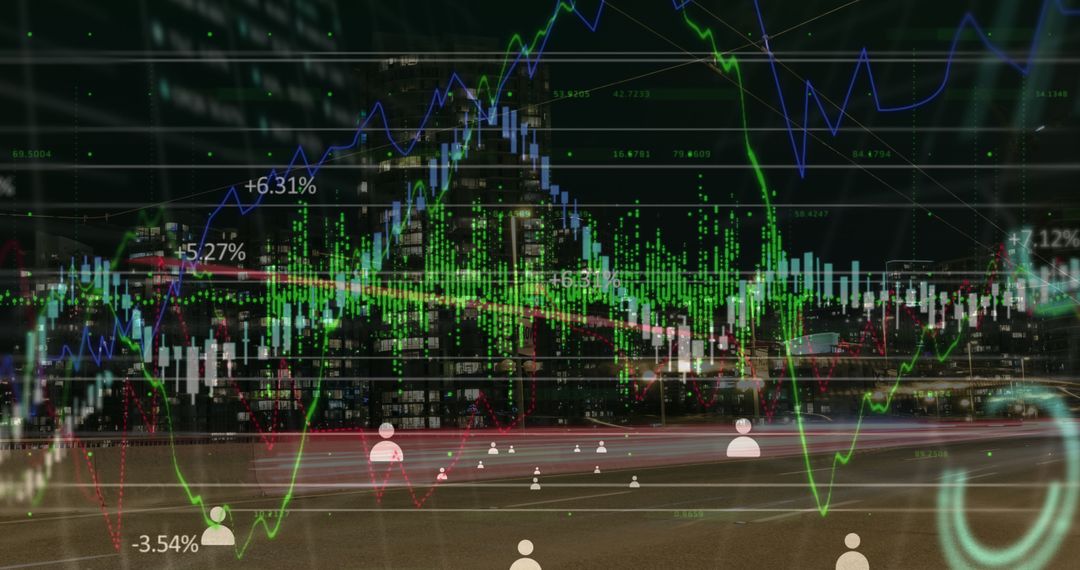
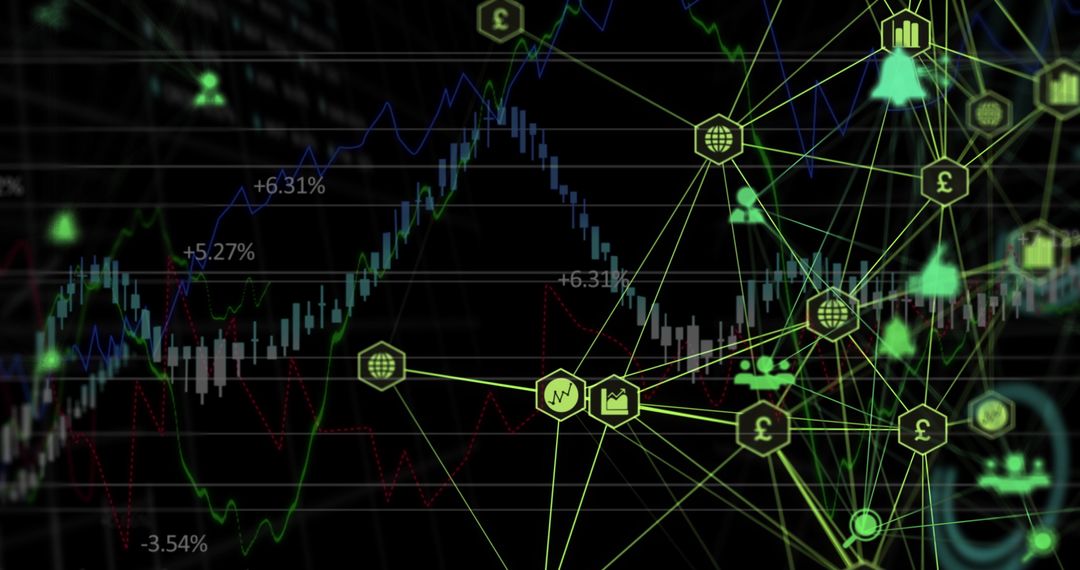
- Global analytics dashboard displaying uptrend line graph over dotted world map with neon HUD
Global analytics dashboard displaying uptrend line graph over dotted world map with neon HUD Image
Depicting dotted world map overlaid with grid and bold uptrend line marked with circular nodes and HUD elements. Neon green flares and subtle honeycomb pattern suggesting cybernetic network and high-tech data center. Working well for website hero banners, presentation covers, annual report headers, fintech landing pages, or social media posts promoting growth, investment, or analytics. Functioning effectively for editorial use about global markets, cybersecurity, network infrastructure, big data, or digital transformation. Providing space for overlaying text, logos, charts, or KPI numbers while maintaining futuristic visual interest. Color palette and composition supporting branding customization, cropping for banners or backgrounds, and animation overlays for video projects.
Powered by  - Get 15% off with code: PIKWIZARD15


0
downloads
downloads
Tags:
More
Credit Photo
If you would like to credit the Photo, here are some ways you can do so
Text Link
photo Link
<span class="text-link">
<span>
<a target="_blank" href=https://pikwizard.com/photo/global-analytics-dashboard-displaying-uptrend-line-graph-over-dotted-world-map-with-neon-hud/21dffce460ed8a3bedd59e985b83215b/>PikWizard</a>
</span>
</span>
<span class="image-link">
<span
style="margin: 0 0 20px 0; display: inline-block; vertical-align: middle; width: 100%;"
>
<a
target="_blank"
href="https://pikwizard.com/photo/global-analytics-dashboard-displaying-uptrend-line-graph-over-dotted-world-map-with-neon-hud/21dffce460ed8a3bedd59e985b83215b/"
style="text-decoration: none; font-size: 10px; margin: 0;"
>
<img src="https://pikwizard.com/pw/medium/21dffce460ed8a3bedd59e985b83215b.jpg" style="margin: 0; width: 100%;" alt="" />
<p style="font-size: 12px; margin: 0;">PikWizard</p>
</a>
</span>
</span>
Free (free of charge)
Free for personal and commercial use.
Author: Awesome Content
Similar Free Stock Images

Premium


Premium


Premium


Premium


Premium


Premium


Premium


Premium


Premium


Premium


Premium


Premium


Premium


Premium