- Home >
- Stock Photos >
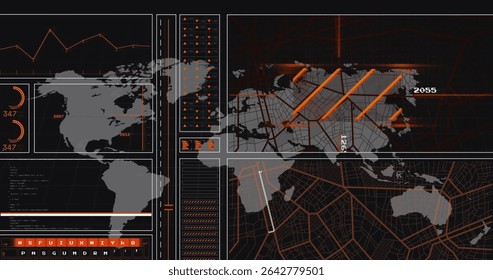
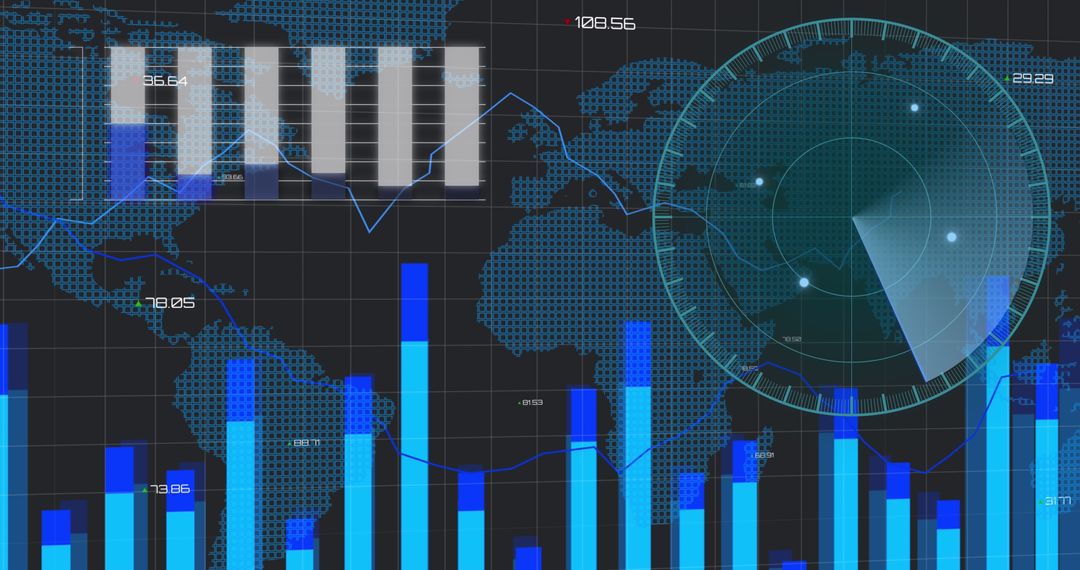
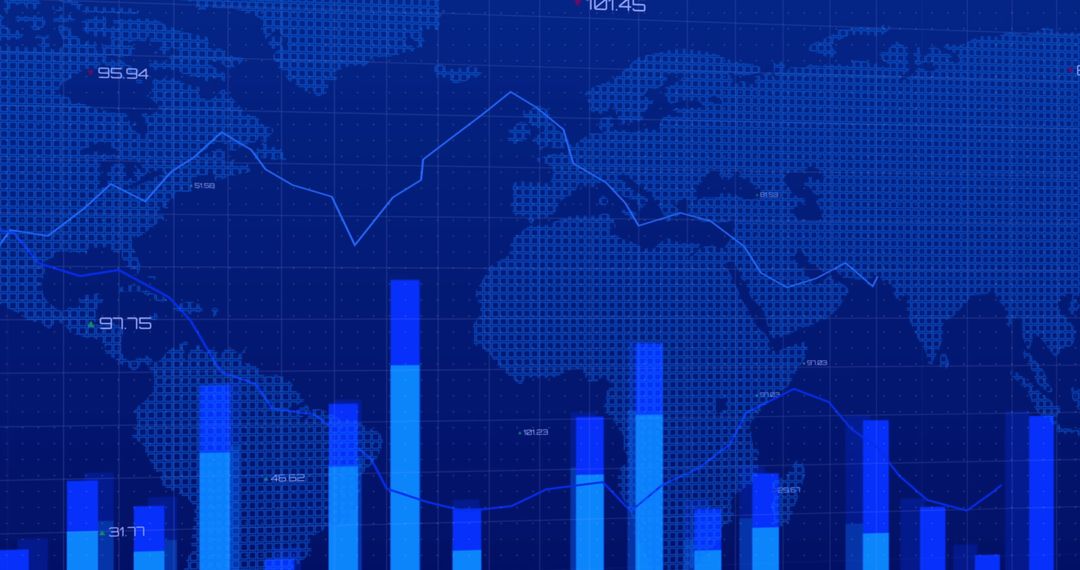
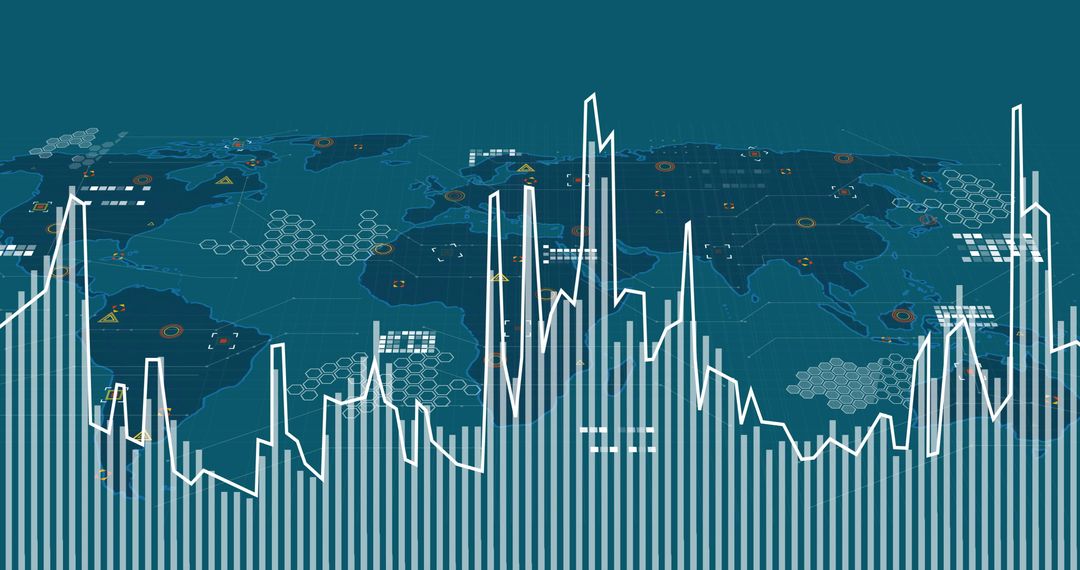
- Global Analytics Dashboard with Bar Charts, Line Graphs, World Map and Connectivity Icons
Global Analytics Dashboard with Bar Charts, Line Graphs, World Map and Connectivity Icons Image

Featuring dotted world map, layered bar charts and line graphs, translucent globe, Wi-Fi and mobile icons, conveying global connectivity and data trends. Ideal for presenting corporate dashboards, financial reports, market analysis, investor decks, and technology articles. Useful for creating website headers, slide backgrounds, infographics, social media visuals, and marketing materials. Working well with tech, finance, telecom, and data science themes; allowing overlaying text, logos, and data callouts.
Powered by  - Get 15% off with code: PIKWIZARD15


0
downloads
downloads
Tags:
More
Credit Photo
If you would like to credit the Photo, here are some ways you can do so
Text Link
photo Link
<span class="text-link">
<span>
<a target="_blank" href=https://pikwizard.com/photo/global-analytics-dashboard-with-bar-charts-line-graphs-world-map-and-connectivity-icons/e9ee30fe5784967dc5ee784e46d24960/>PikWizard</a>
</span>
</span>
<span class="image-link">
<span
style="margin: 0 0 20px 0; display: inline-block; vertical-align: middle; width: 100%;"
>
<a
target="_blank"
href="https://pikwizard.com/photo/global-analytics-dashboard-with-bar-charts-line-graphs-world-map-and-connectivity-icons/e9ee30fe5784967dc5ee784e46d24960/"
style="text-decoration: none; font-size: 10px; margin: 0;"
>
<img src="https://pikwizard.com/pw/medium/e9ee30fe5784967dc5ee784e46d24960.jpg" style="margin: 0; width: 100%;" alt="" />
<p style="font-size: 12px; margin: 0;">PikWizard</p>
</a>
</span>
</span>
Free (free of charge)
Free for personal and commercial use.
Author: Authentic Images
Similar Free Stock Images
Premium


Premium


Premium


Premium

Premium


Premium


Premium


Premium


Premium


Premium


Premium


Premium


Premium


Premium


Premium


Premium


Premium


Premium


Premium


Premium


Premium


Premium


Premium


Premium