- Home >
- Stock Photos >
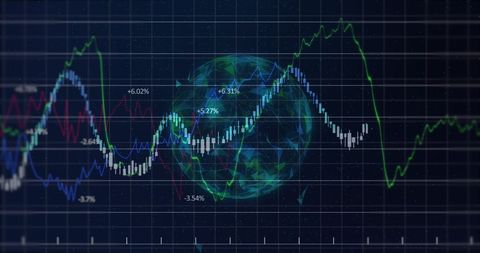
- Global Analytics Dashboard with Zigzag Chart on Dark Interface
Global Analytics Dashboard with Zigzag Chart on Dark Interface Image

Vector design featuring dashboard for analytics, showcasing zigzag chart on world map and dark interface with bar charts. Useful for illustrating concepts related to data analysis, business strategy, technology, and financial markets. Suitable for presentations, reports, and educational materials emphasizing technological advancements and digital data interpretation.
Powered by  - Get 15% off with code: PIKWIZARD15


downloads
Tags:
More
Credit Photo
If you would like to credit the Photo, here are some ways you can do so
Text Link
photo Link
<span class="text-link">
<span>
<a target="_blank" href=https://pikwizard.com/photo/global-analytics-dashboard-with-zigzag-chart-on-dark-interface/d981c46b5a249ef7c93a2c61e6accc07/>PikWizard</a>
</span>
</span>
<span class="image-link">
<span
style="margin: 0 0 20px 0; display: inline-block; vertical-align: middle; width: 100%;"
>
<a
target="_blank"
href="https://pikwizard.com/photo/global-analytics-dashboard-with-zigzag-chart-on-dark-interface/d981c46b5a249ef7c93a2c61e6accc07/"
style="text-decoration: none; font-size: 10px; margin: 0;"
>
<img src="https://pikwizard.com/pw/medium/d981c46b5a249ef7c93a2c61e6accc07.jpg" style="margin: 0; width: 100%;" alt="" />
<p style="font-size: 12px; margin: 0;">PikWizard</p>
</a>
</span>
</span>
Free (free of charge)
Free for personal and commercial use.
Author: Awesome Content