- Home >
- Stock Photos >
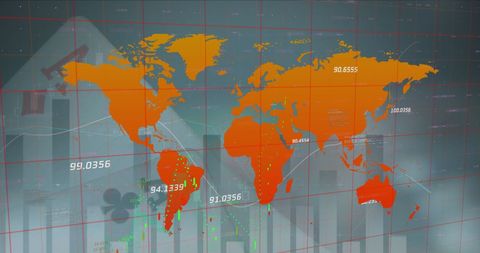
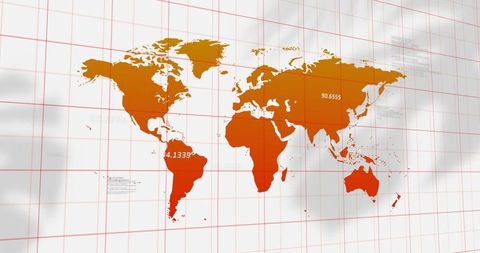
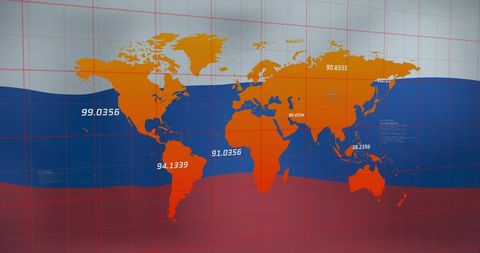
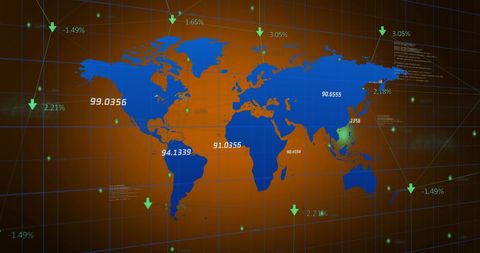
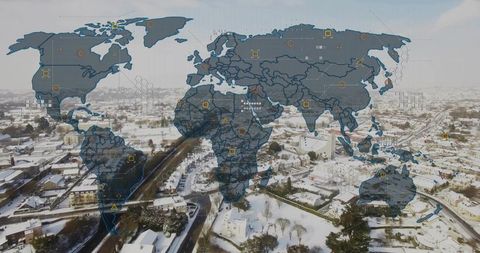
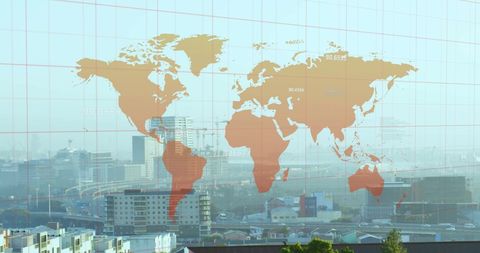
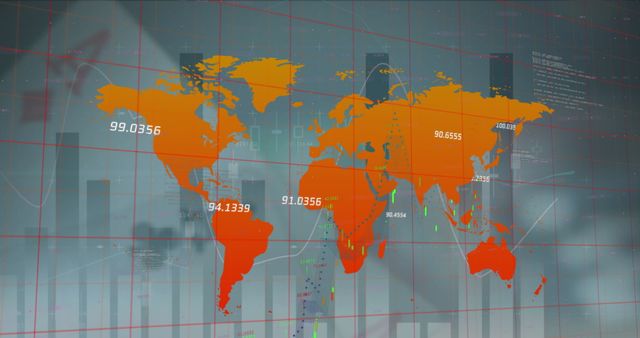
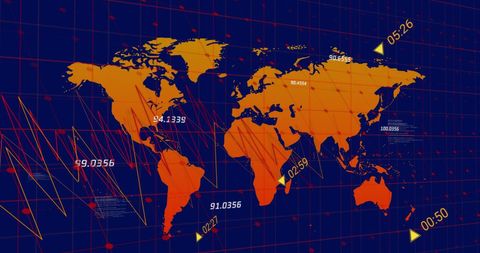
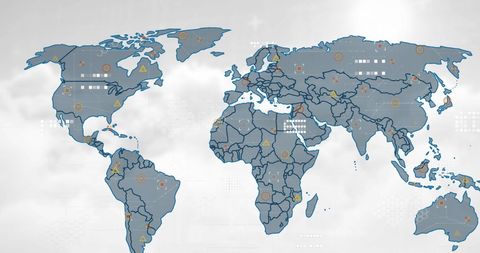
- Global Analytics Map with Mathematical Diagrams and Graphs
Global Analytics Map with Mathematical Diagrams and Graphs Image
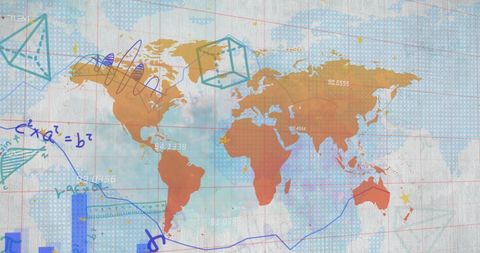
This graphic showcases a world map intertwined with mathematical equations, graphs, and data diagrams. Ideal for presentations, educational materials, or articles focusing on global trade, economics, analytics, and technology advancement. Its modern aesthetic appeals to those discussing innovation, geographical distribution of data or market research.
Powered by  - Get 15% off with code: PIKWIZARD15


downloads
Tags:
More
Credit Photo
If you would like to credit the Photo, here are some ways you can do so
Text Link
photo Link
<span class="text-link">
<span>
<a target="_blank" href=https://pikwizard.com/photo/global-analytics-map-with-mathematical-diagrams-and-graphs/ee7f95ab5fc7721c3c3a6f1771f8a60e/>PikWizard</a>
</span>
</span>
<span class="image-link">
<span
style="margin: 0 0 20px 0; display: inline-block; vertical-align: middle; width: 100%;"
>
<a
target="_blank"
href="https://pikwizard.com/photo/global-analytics-map-with-mathematical-diagrams-and-graphs/ee7f95ab5fc7721c3c3a6f1771f8a60e/"
style="text-decoration: none; font-size: 10px; margin: 0;"
>
<img src="https://pikwizard.com/pw/medium/ee7f95ab5fc7721c3c3a6f1771f8a60e.jpg" style="margin: 0; width: 100%;" alt="" />
<p style="font-size: 12px; margin: 0;">PikWizard</p>
</a>
</span>
</span>
Free (free of charge)
Free for personal and commercial use.
Author: Authentic Images
Similar Free Stock Images
Loading...

Premium


Premium


Premium

Premium


Premium


Premium

Premium

Premium


Premium


Premium

Premium

Premium


Premium

Premium


Premium

Premium

Premium


Premium


Premium


Premium


Premium

Premium

Premium


Premium


Premium