- Home >
- Stock Photos >
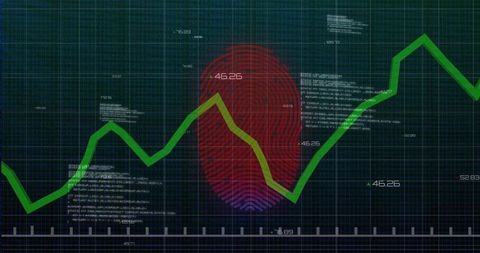
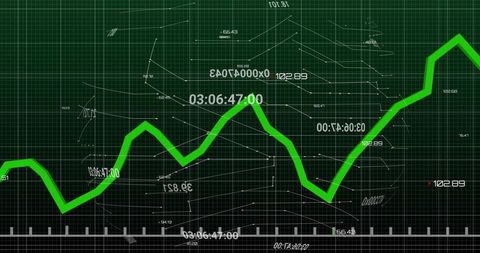
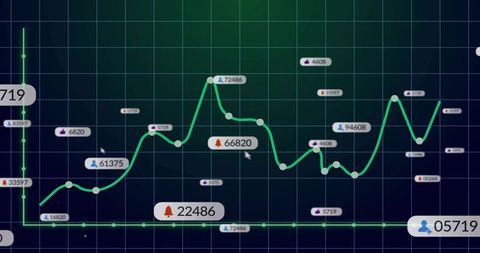
- Global Analytics with Futuristic Interface and Grid Overlay
Global Analytics with Futuristic Interface and Grid Overlay Image

This dynamic representation of a world atlas features a neon graph overlay with distinct markers and numeric annotations over a green grid. Designed for a high-tech ambiance, it is ideal for use in projects relating to geographic data presentation, analytical reviews, or digital interfaces. Marks with geographic coordinates are useful for visuals about economic trends, technological pursuits, or financial forecasts.

downloads
Tags:
More
Credit Photo
If you would like to credit the Photo, here are some ways you can do so
Text Link
photo Link
<span class="text-link">
<span>
<a target="_blank" href=https://pikwizard.com/photo/global-analytics-with-futuristic-interface-and-grid-overlay/8ff7a5960bcbfdffe5b339b53f206ae7/>PikWizard</a>
</span>
</span>
<span class="image-link">
<span
style="margin: 0 0 20px 0; display: inline-block; vertical-align: middle; width: 100%;"
>
<a
target="_blank"
href="https://pikwizard.com/photo/global-analytics-with-futuristic-interface-and-grid-overlay/8ff7a5960bcbfdffe5b339b53f206ae7/"
style="text-decoration: none; font-size: 10px; margin: 0;"
>
<img src="https://pikwizard.com/pw/medium/8ff7a5960bcbfdffe5b339b53f206ae7.jpg" style="margin: 0; width: 100%;" alt="" />
<p style="font-size: 12px; margin: 0;">PikWizard</p>
</a>
</span>
</span>
Free (free of charge)
Free for personal and commercial use.
Author: Awesome Content