
- Home >
- Stock Photos >
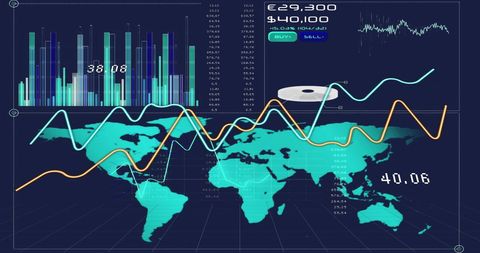
- Global Business Analytics and Growth Concept Hologram
Global Business Analytics and Growth Concept Hologram Image

Holographic display of bar graphs and a map represents global business trends and analytics. Ideal for illustrating growth concepts, business reports, financial forecasting, or data-driven strategy planning visuals for presentations and educational materials.
Powered by  - Get 15% off with code: PIKWIZARD15


2
downloads
downloads
Tags:
More
Credit Photo
If you would like to credit the Photo, here are some ways you can do so
Text Link
photo Link
<span class="text-link">
<span>
<a target="_blank" href=https://pikwizard.com/photo/global-business-analytics-and-growth-concept-hologram/7a386eeb1e061650c8e5293cd18ca6f4/>PikWizard</a>
</span>
</span>
<span class="image-link">
<span
style="margin: 0 0 20px 0; display: inline-block; vertical-align: middle; width: 100%;"
>
<a
target="_blank"
href="https://pikwizard.com/photo/global-business-analytics-and-growth-concept-hologram/7a386eeb1e061650c8e5293cd18ca6f4/"
style="text-decoration: none; font-size: 10px; margin: 0;"
>
<img src="https://pikwizard.com/pw/medium/7a386eeb1e061650c8e5293cd18ca6f4.jpg" style="margin: 0; width: 100%;" alt="" />
<p style="font-size: 12px; margin: 0;">PikWizard</p>
</a>
</span>
</span>
Free (free of charge)
Free for personal and commercial use.
Author: Authentic Images
Similar Free Stock Images
Loading...

Premium


Premium

Premium


Premium


Premium


Premium

Premium


Premium


Premium


Premium

Premium


Premium

Premium


Premium


Premium

Premium


Premium


Premium


Premium


Premium


Premium


Premium

Premium


Premium


Premium

