
- Home >
- Stock Photos >
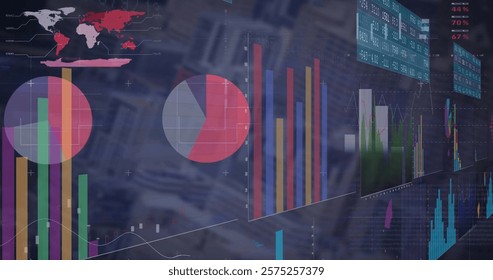
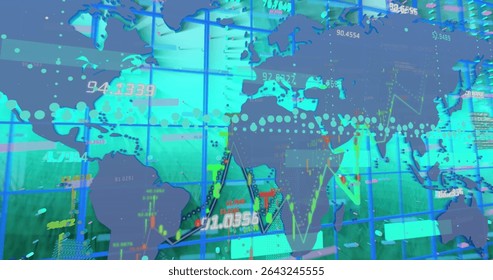
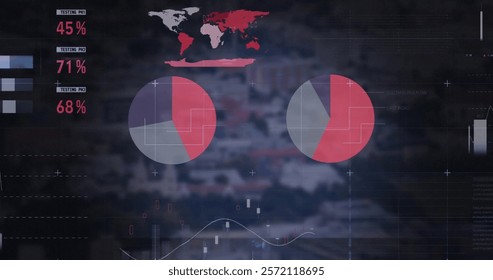
- Global Business Analytics with Graph and Map Elements
Global Business Analytics with Graph and Map Elements Image

Graphic illustrates global business analytics using elements like world map, pie charts, and line graphs, exuding a modern technological appeal. Ideal for corporate presentations related to strategy, financial analysis, dashboard visualization, or describing market dynamics and data-driven insights in professional settings.
Powered by  - Get 15% off with code: PIKWIZARD15


downloads
Tags:
More
Credit Photo
If you would like to credit the Photo, here are some ways you can do so
Text Link
photo Link
<span class="text-link">
<span>
<a target="_blank" href=https://pikwizard.com/photo/global-business-analytics-with-graph-and-map-elements/a434622c5543078c9a13abd1a64795b4/>PikWizard</a>
</span>
</span>
<span class="image-link">
<span
style="margin: 0 0 20px 0; display: inline-block; vertical-align: middle; width: 100%;"
>
<a
target="_blank"
href="https://pikwizard.com/photo/global-business-analytics-with-graph-and-map-elements/a434622c5543078c9a13abd1a64795b4/"
style="text-decoration: none; font-size: 10px; margin: 0;"
>
<img src="https://pikwizard.com/pw/medium/a434622c5543078c9a13abd1a64795b4.jpg" style="margin: 0; width: 100%;" alt="" />
<p style="font-size: 12px; margin: 0;">PikWizard</p>
</a>
</span>
</span>
Free (free of charge)
Free for personal and commercial use.
Author: Creative Art
Similar Free Stock Images

Premium


Premium

Premium


Premium


Premium

Premium


Premium


Premium


Premium


Premium


Premium


Premium


Premium


Premium


Premium


Premium


Premium


Premium


Premium
Premium


Premium

Premium


Premium


Premium


Premium


Explore More Free Stock Images