- Home >
- Stock Photos >
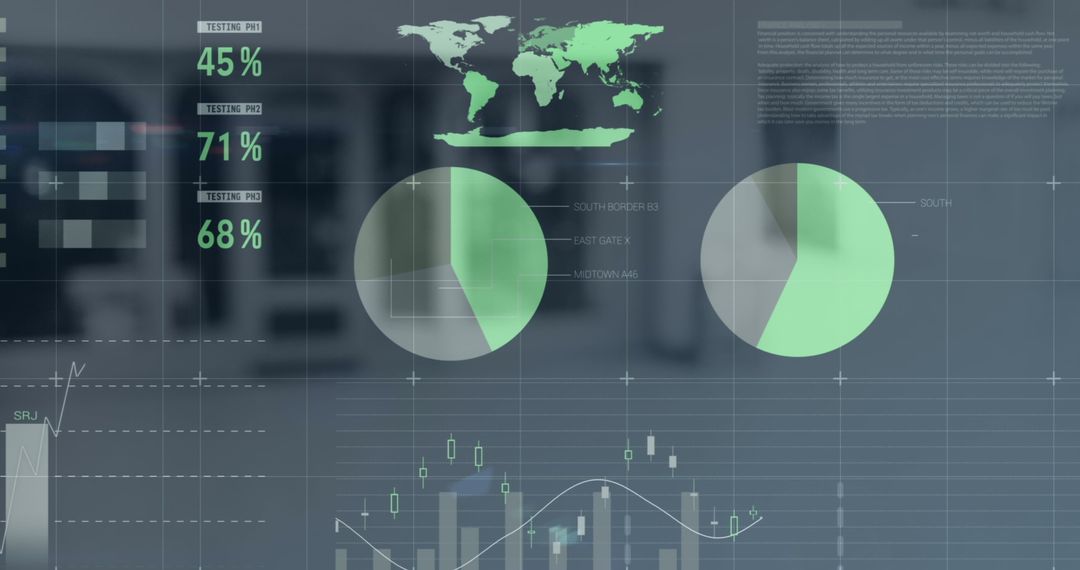
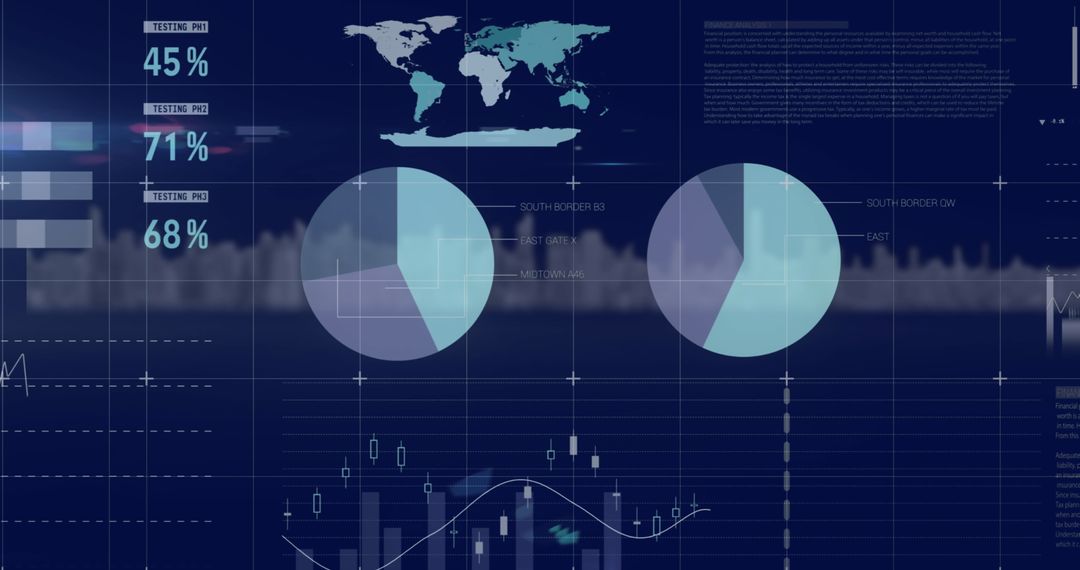
- Global Business Data Analysis Dashboard
Global Business Data Analysis Dashboard Image

Abstract representation of global business data processing and analysis. Includes pie charts, world maps, and statistical visuals over a digital interface. Ideal for presentations on technology in business, data analysis insights, global market research, or financial reports forecasting global trends. Accents modern connectivity and information flow eclectic with digital marketing materials.
Powered by  - Get 15% off with code: PIKWIZARD15


2
downloads
downloads
Tags:
More
Credit Photo
If you would like to credit the Photo, here are some ways you can do so
Text Link
photo Link
<span class="text-link">
<span>
<a target="_blank" href=https://pikwizard.com/photo/global-business-data-analysis-dashboard/d589dfee30183f2406613bb78e4a5942/>PikWizard</a>
</span>
</span>
<span class="image-link">
<span
style="margin: 0 0 20px 0; display: inline-block; vertical-align: middle; width: 100%;"
>
<a
target="_blank"
href="https://pikwizard.com/photo/global-business-data-analysis-dashboard/d589dfee30183f2406613bb78e4a5942/"
style="text-decoration: none; font-size: 10px; margin: 0;"
>
<img src="https://pikwizard.com/pw/medium/d589dfee30183f2406613bb78e4a5942.jpg" style="margin: 0; width: 100%;" alt="" />
<p style="font-size: 12px; margin: 0;">PikWizard</p>
</a>
</span>
</span>
Free (free of charge)
Free for personal and commercial use.
Author: Awesome Content
Similar Free Stock Images

Premium


Premium


Premium


Premium


Premium


Premium


Premium


Premium


Premium


Premium


Premium


Premium


Premium


Premium


Premium


Premium


Premium


Premium


Premium


Premium


Premium


Premium


Premium


Premium