- Home >
- Stock Photos >
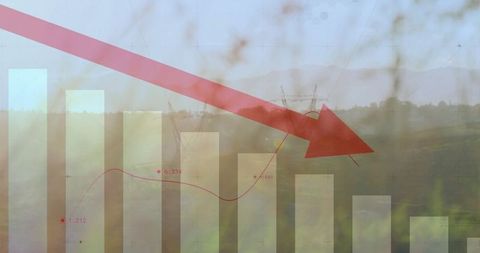
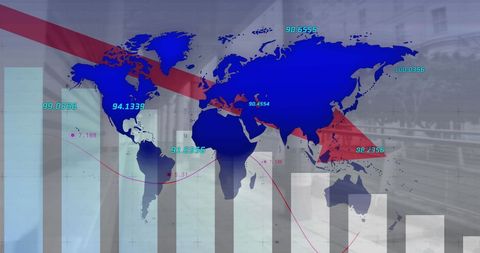
- Global Business Decline and Economic Downturn Concept
Global Business Decline and Economic Downturn Concept Image

Image depicts a significant decline in global business trends through a digital arrow overlay cascading downward across various data graphs. Encompasses both current technology and traditional office settings photographed underlay Room for conceptual uses such as conveying declining markets in business presentations, financial analysis forecasts or digital transformation seminars.
Powered by 


2
downloads
downloads
Tags:
More
Credit Photo
If you would like to credit the Photo, here are some ways you can do so
Text Link
photo Link
<span class="text-link">
<span>
<a target="_blank" href=https://pikwizard.com/photo/global-business-decline-and-economic-downturn-concept/d0168dae8e594e5f6b636e9f65485543/>PikWizard</a>
</span>
</span>
<span class="image-link">
<span
style="margin: 0 0 20px 0; display: inline-block; vertical-align: middle; width: 100%;"
>
<a
target="_blank"
href="https://pikwizard.com/photo/global-business-decline-and-economic-downturn-concept/d0168dae8e594e5f6b636e9f65485543/"
style="text-decoration: none; font-size: 10px; margin: 0;"
>
<img src="https://pikwizard.com/pw/medium/d0168dae8e594e5f6b636e9f65485543.jpg" style="margin: 0; width: 100%;" alt="" />
<p style="font-size: 12px; margin: 0;">PikWizard</p>
</a>
</span>
</span>
Free (free of charge)
Free for personal and commercial use.
Author: Awesome Content
Similar Free Stock Images
Loading...

Premium


Premium


Premium

Premium


Premium


Premium


Premium

Premium

Premium

Premium


Premium


Premium


Premium


Premium


Premium

Premium

Premium


Premium


Premium


Premium


Premium


Premium


Premium


Premium

Premium