- Home >
- Stock Photos >
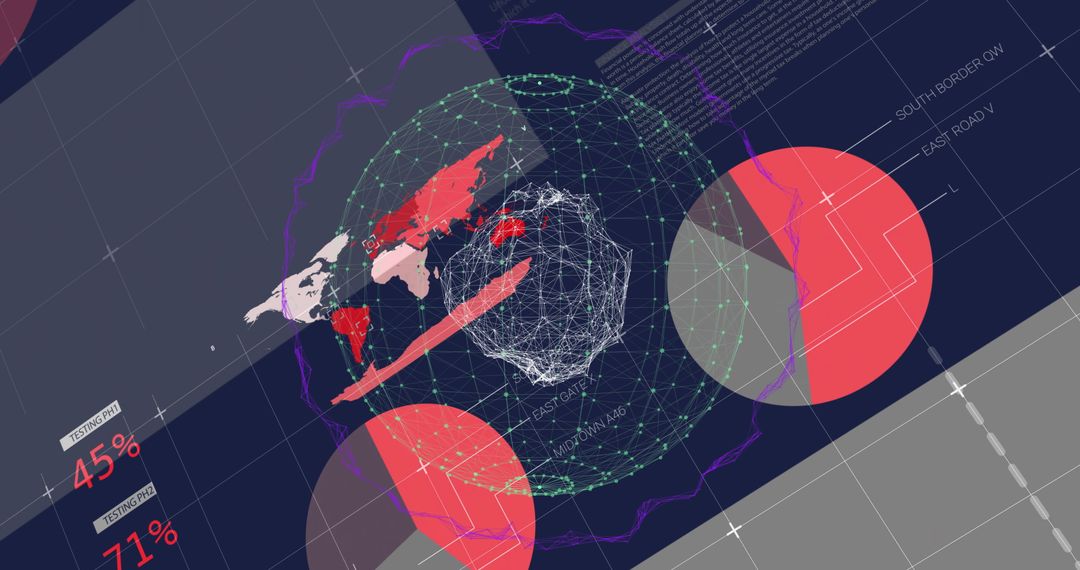
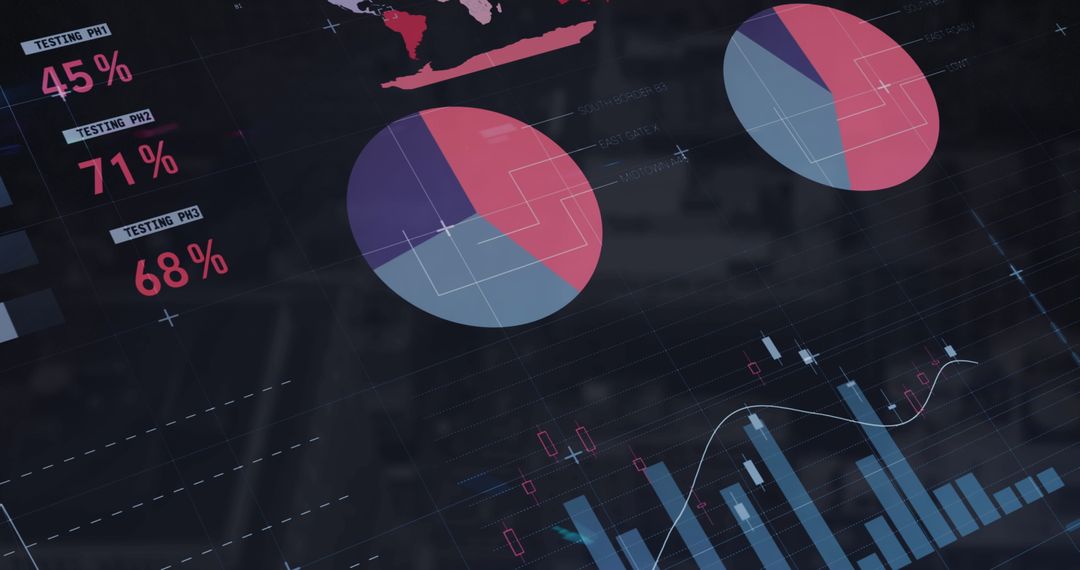
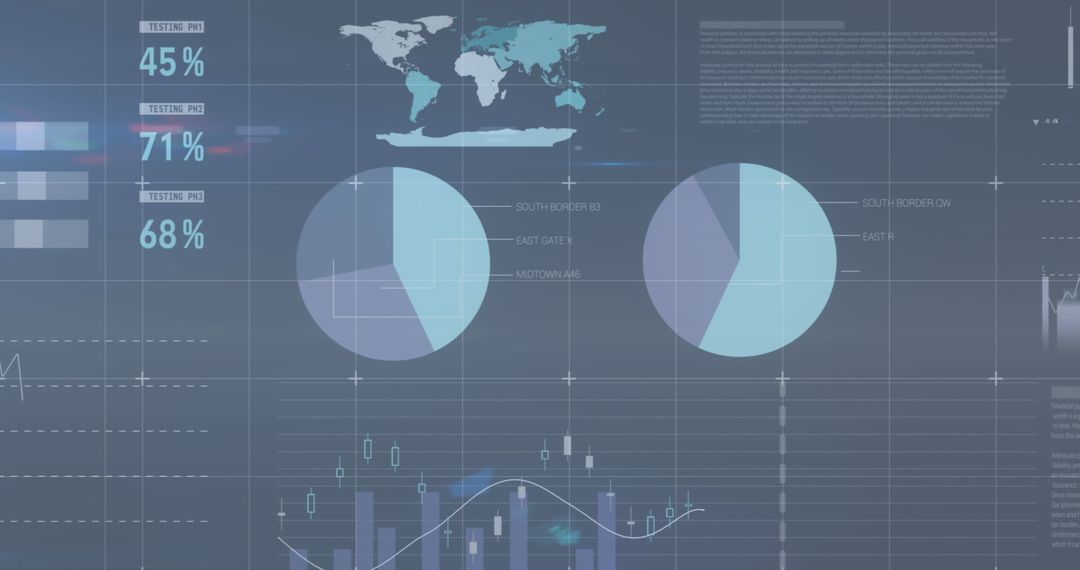
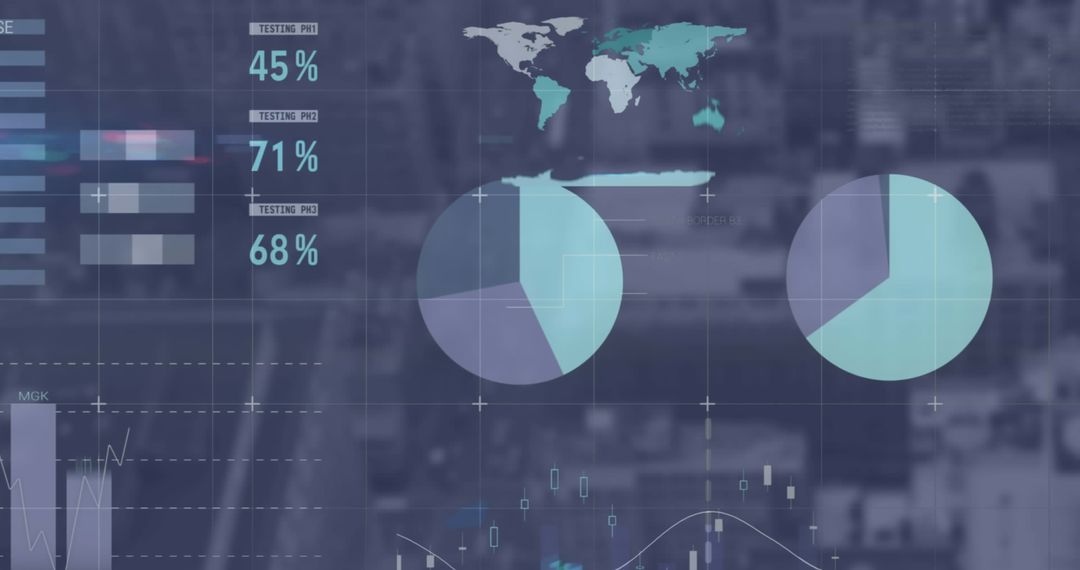
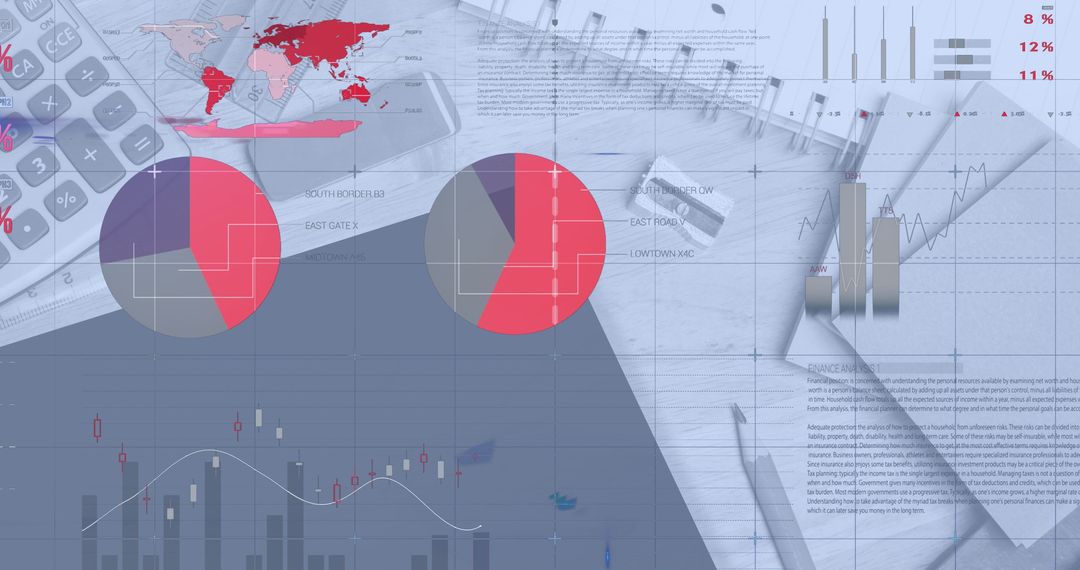
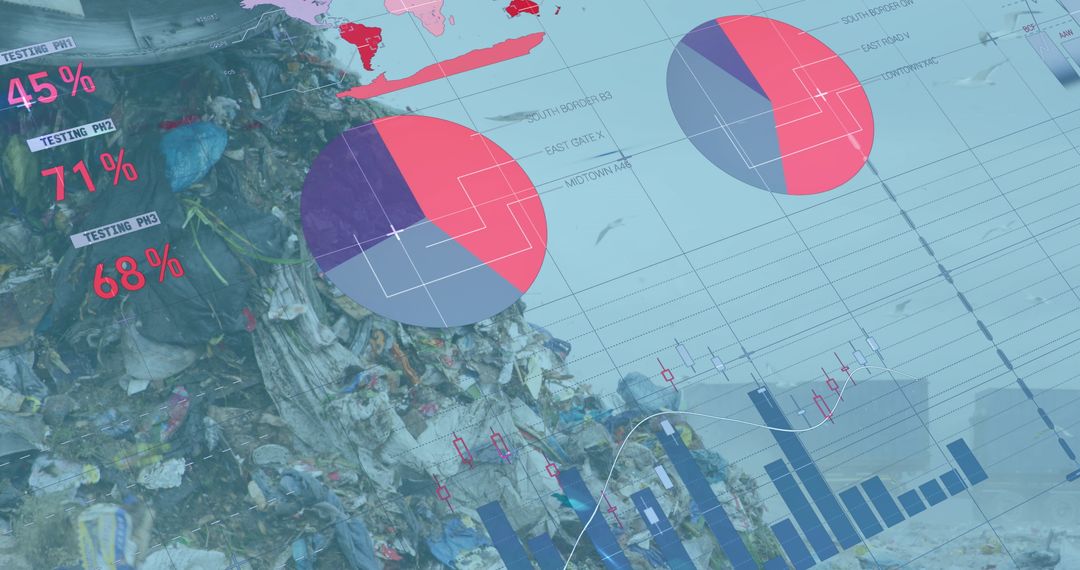
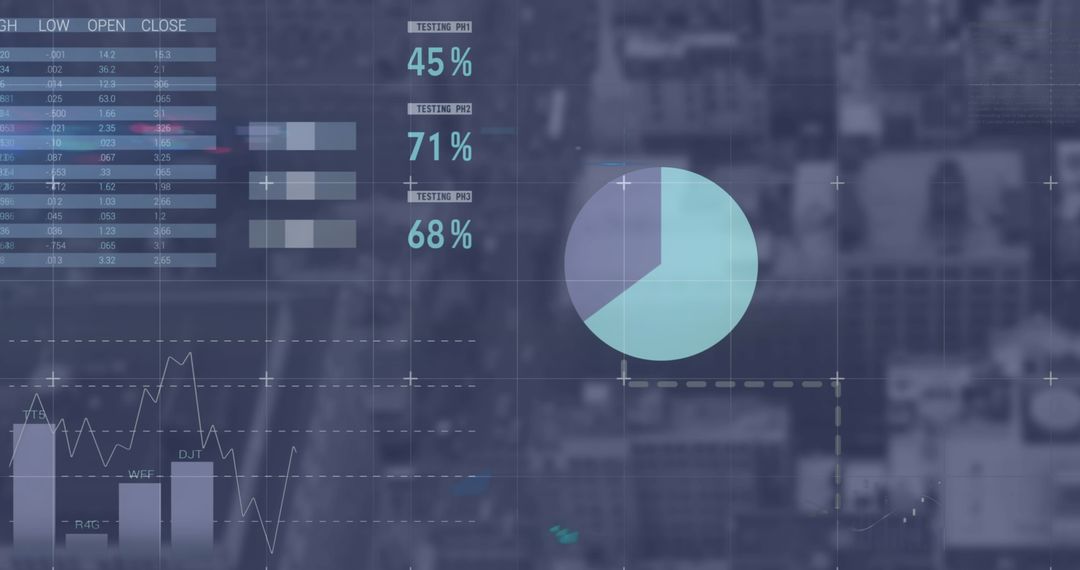
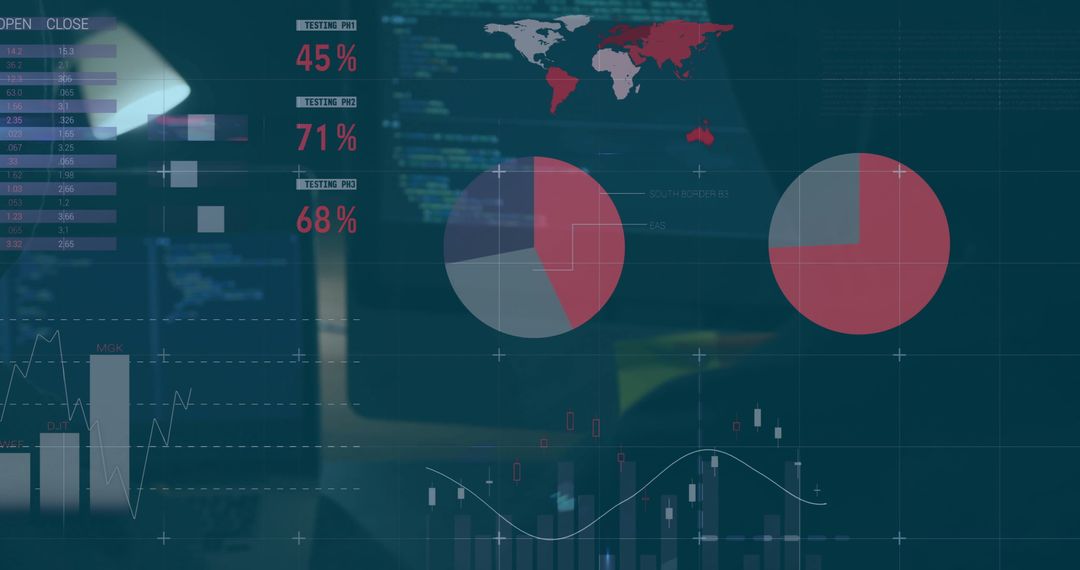
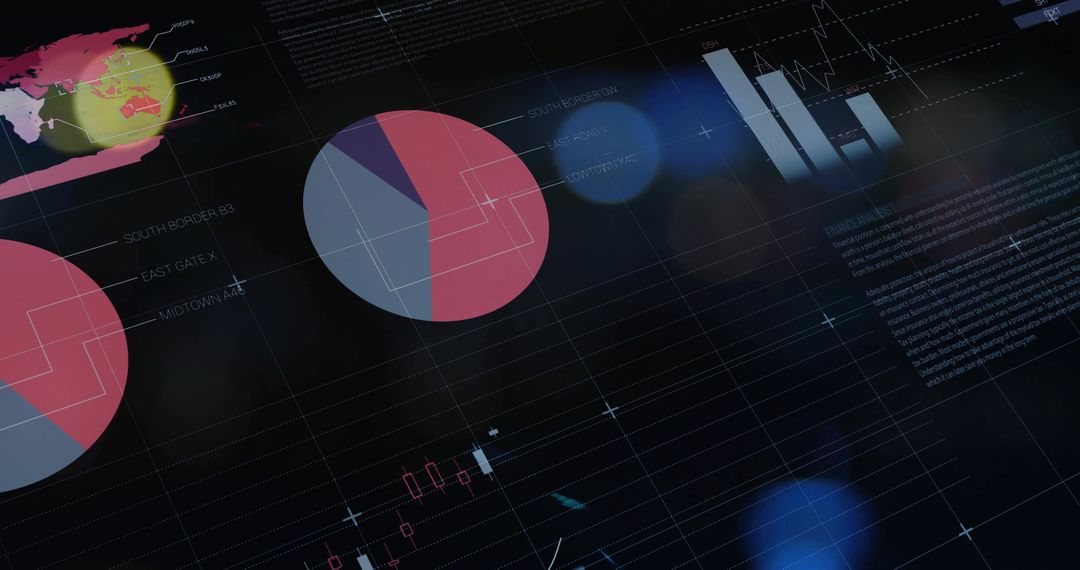
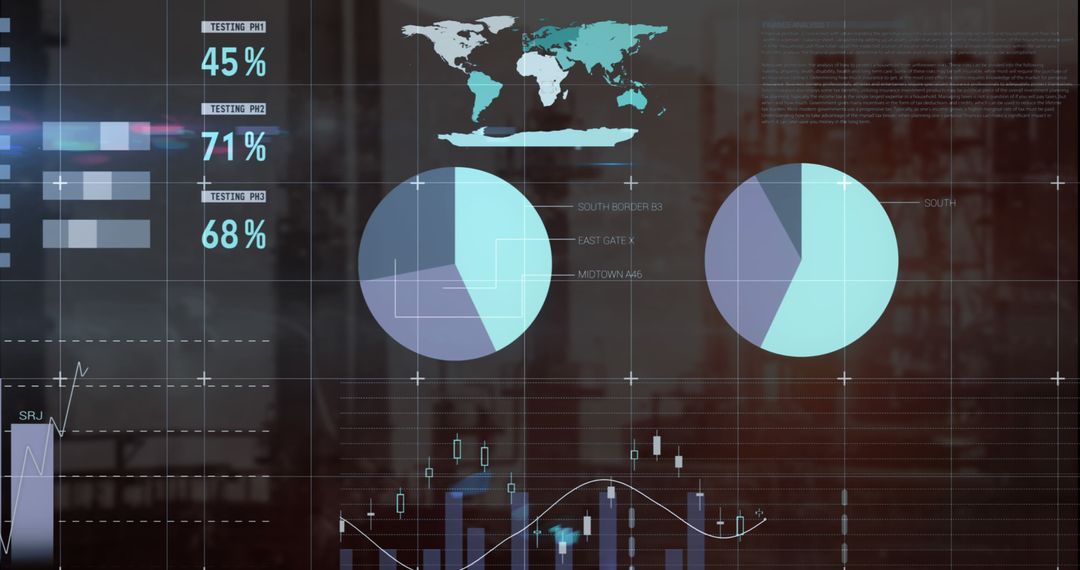
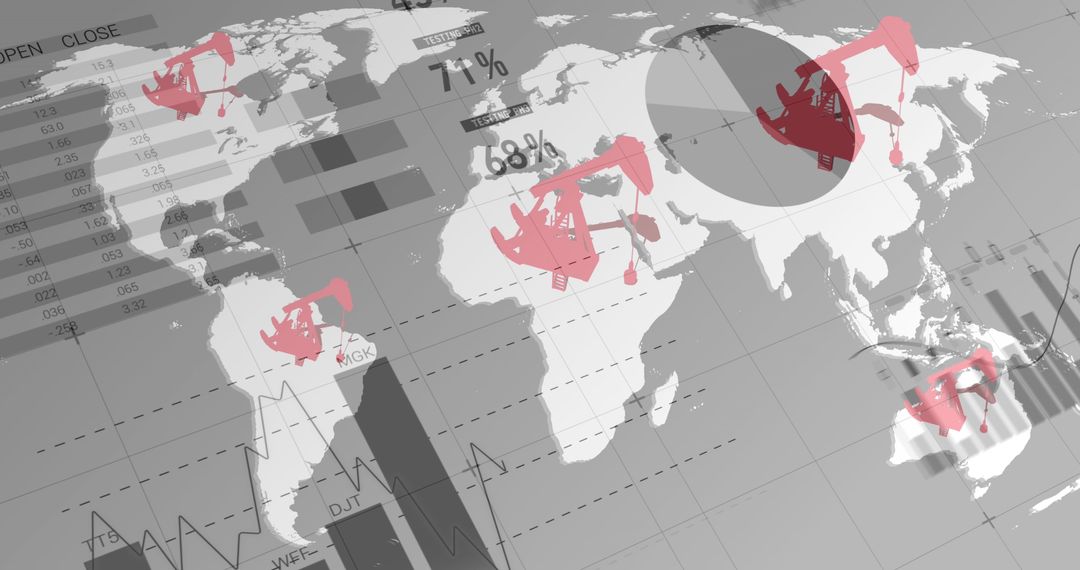
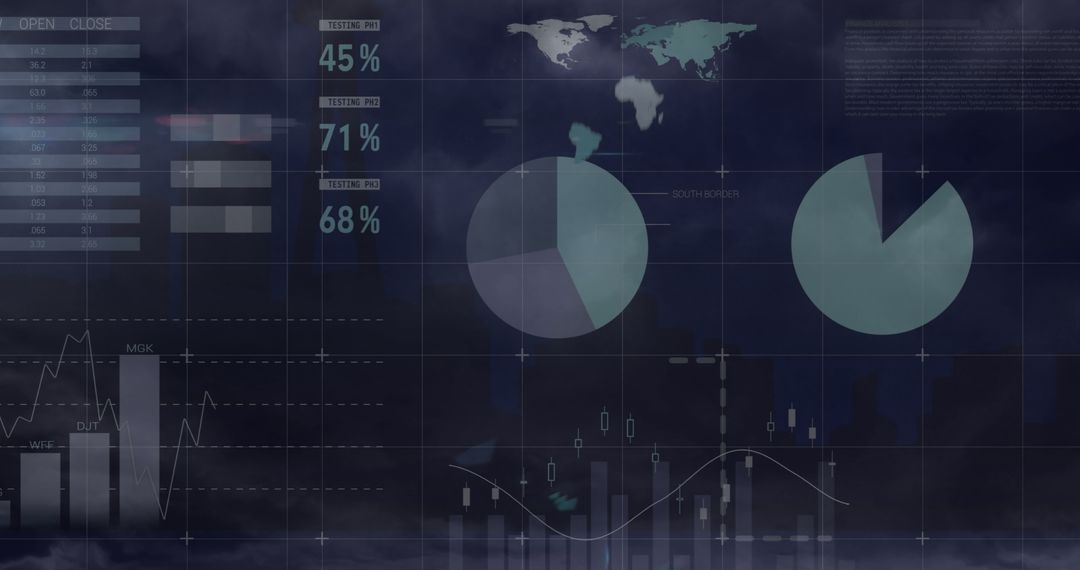
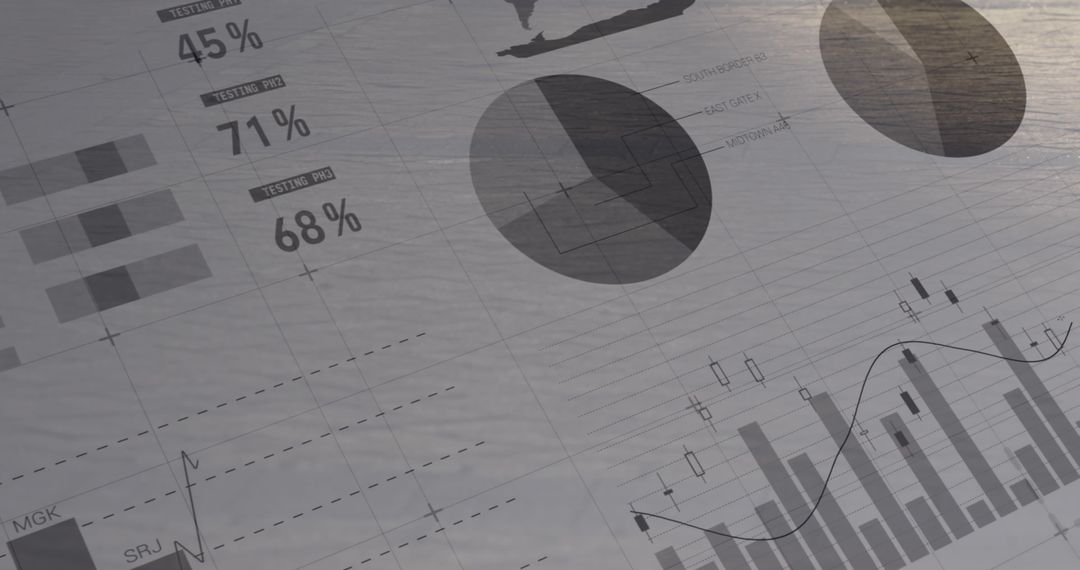
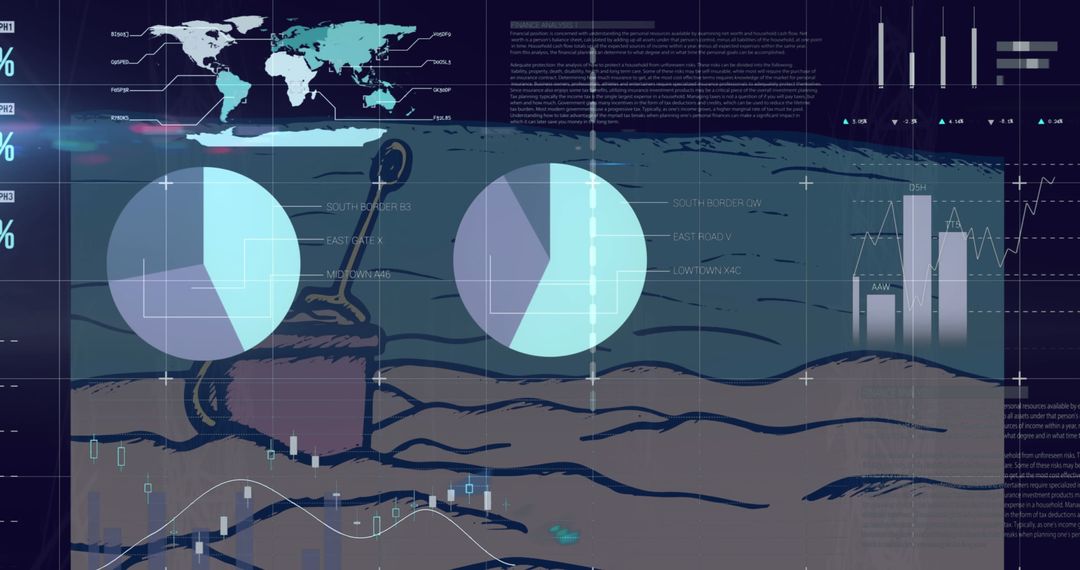
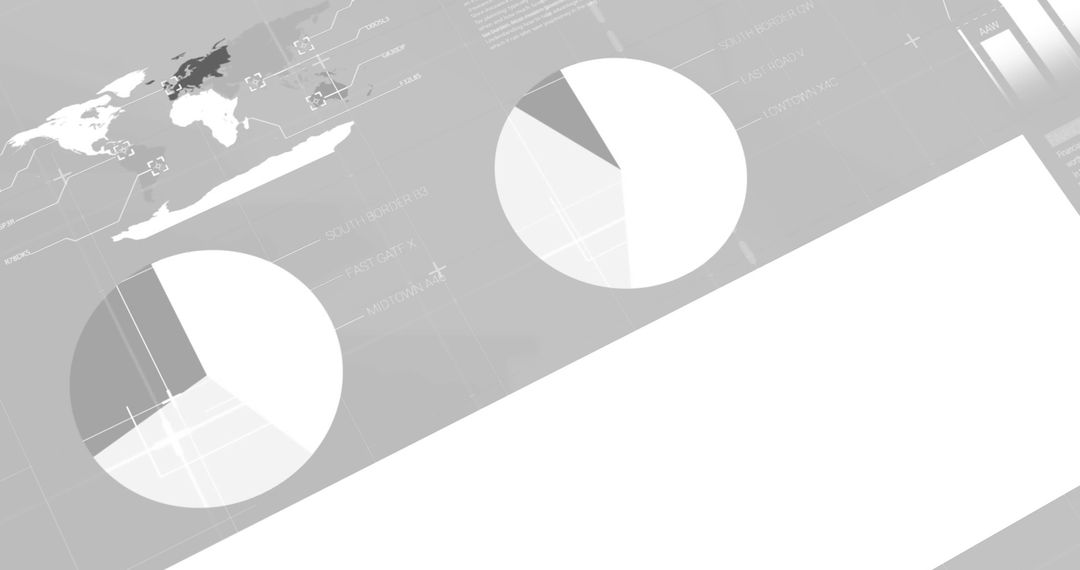
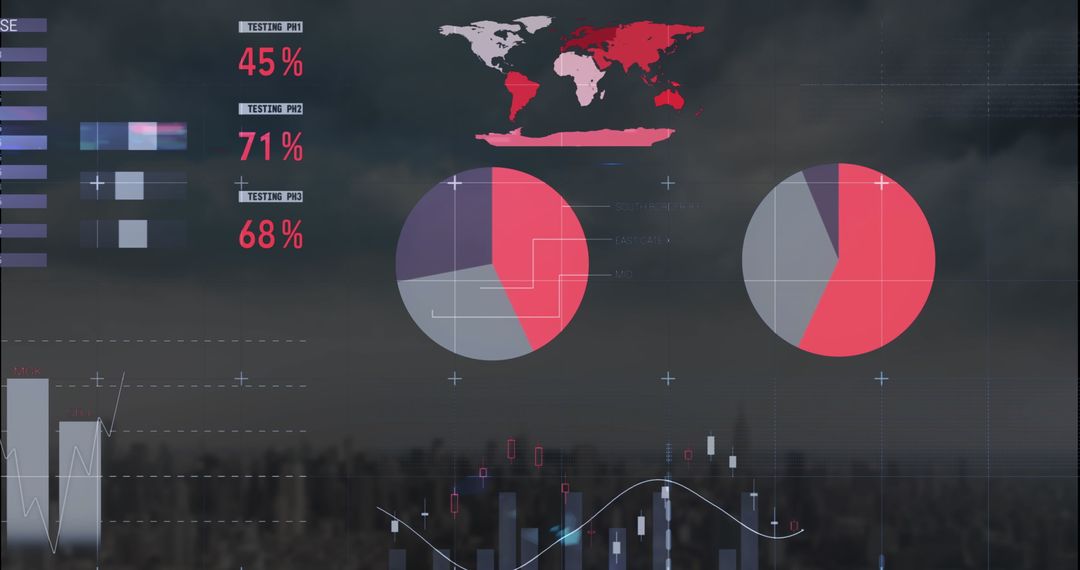
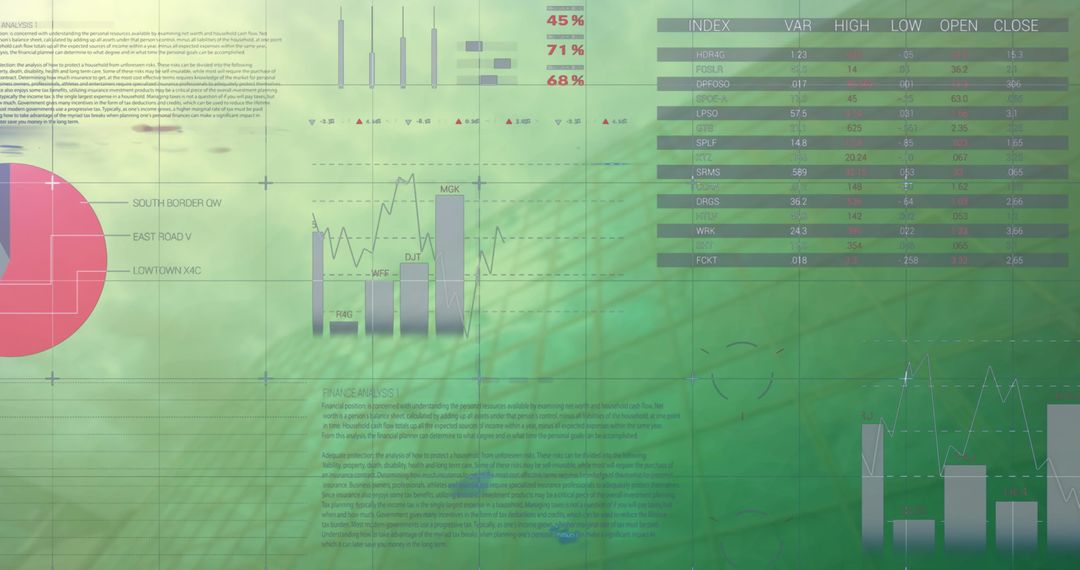
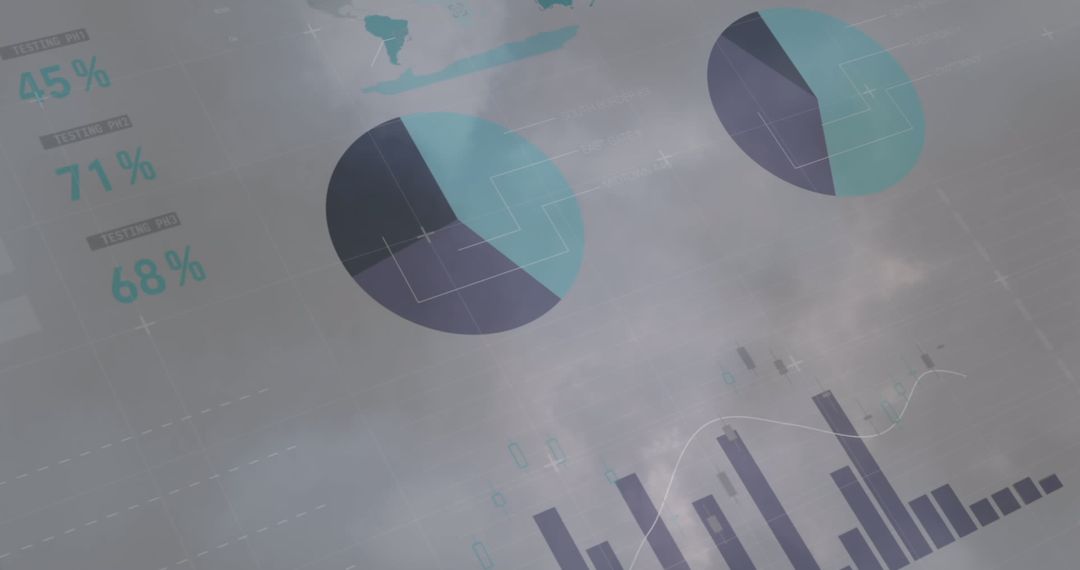
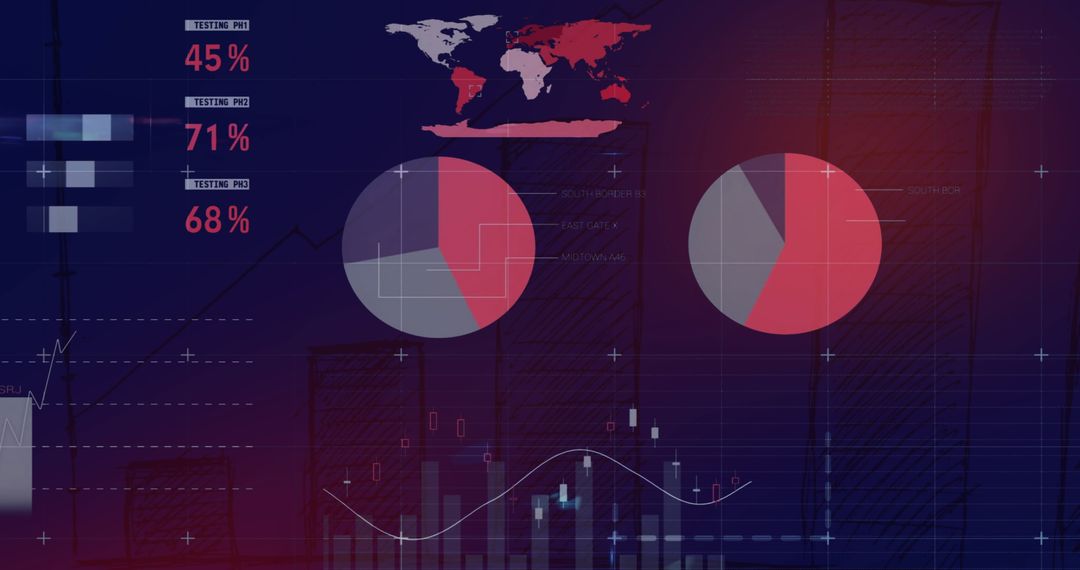
- Global Business Financial Data Analysis with Infographics
Global Business Financial Data Analysis with Infographics Image
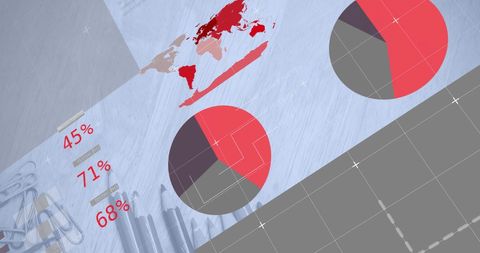
Visualizing financial data aligned with business strategy, this illustration is ideal for financial reports, corporate presentations, or business plan documentation. Features prominent use of pie charts and map enhancing understanding of interconnected market trends.
Powered by  - Get 15% off with code: PIKWIZARD15


2
downloads
downloads
Tags:
More
Credit Photo
If you would like to credit the Photo, here are some ways you can do so
Text Link
photo Link
<span class="text-link">
<span>
<a target="_blank" href=https://pikwizard.com/photo/global-business-financial-data-analysis-with-infographics/002678e7c010bc136c59327efc00d9ac/>PikWizard</a>
</span>
</span>
<span class="image-link">
<span
style="margin: 0 0 20px 0; display: inline-block; vertical-align: middle; width: 100%;"
>
<a
target="_blank"
href="https://pikwizard.com/photo/global-business-financial-data-analysis-with-infographics/002678e7c010bc136c59327efc00d9ac/"
style="text-decoration: none; font-size: 10px; margin: 0;"
>
<img src="https://pikwizard.com/pw/medium/002678e7c010bc136c59327efc00d9ac.jpg" style="margin: 0; width: 100%;" alt="" />
<p style="font-size: 12px; margin: 0;">PikWizard</p>
</a>
</span>
</span>
Free (free of charge)
Free for personal and commercial use.
Author: Awesome Content
Similar Free Stock Images

Premium


Premium


Premium


Premium


Premium


Premium


Premium


Premium


Premium


Premium


Premium


Premium


Premium


Premium


Premium


Premium


Premium


Premium


Premium


Premium


Premium


Premium


Premium


Premium