
- Home >
- Stock Photos >
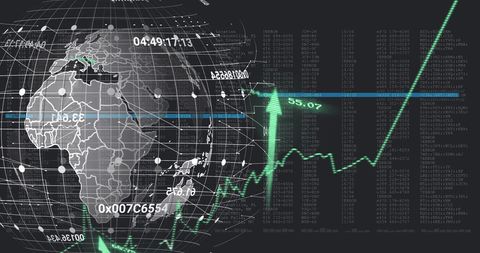
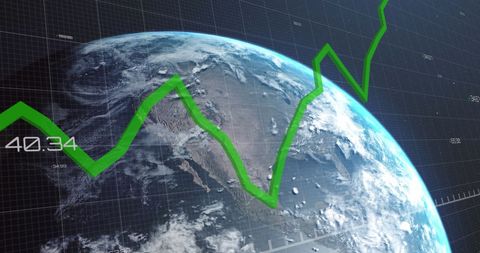
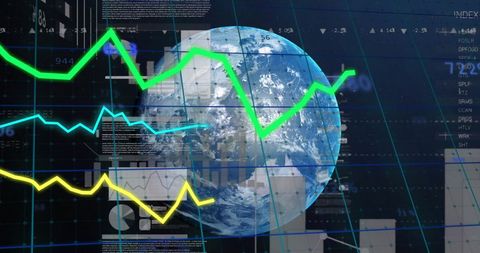
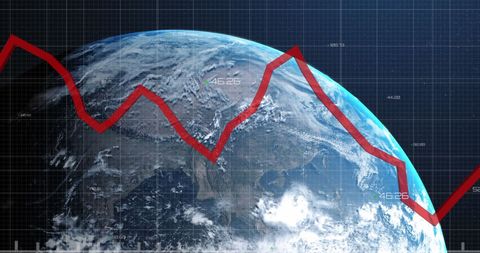
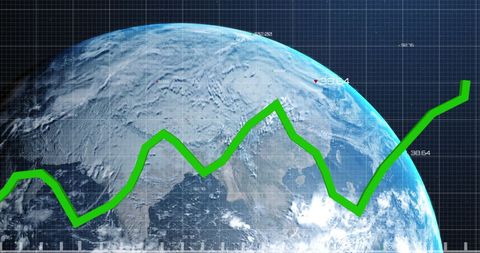
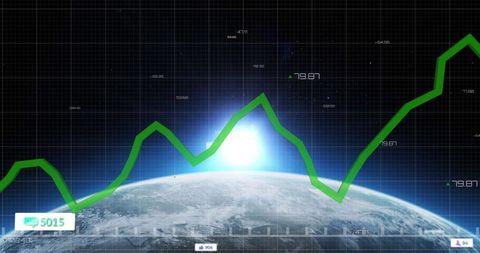
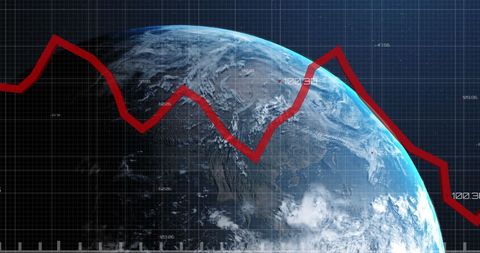
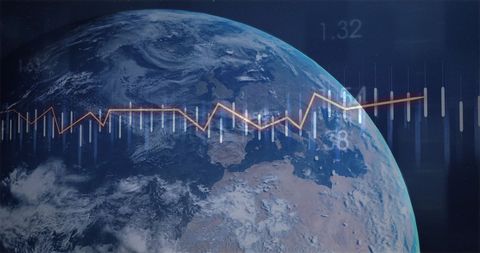
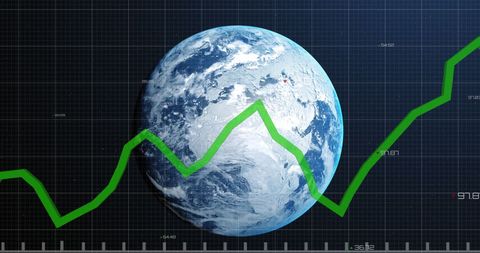
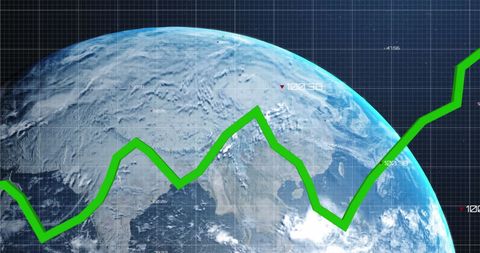
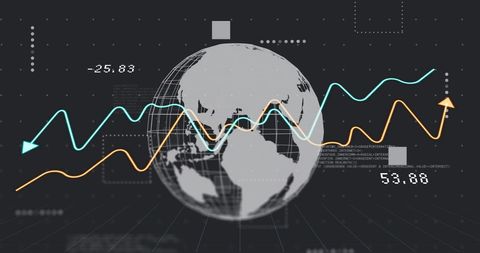
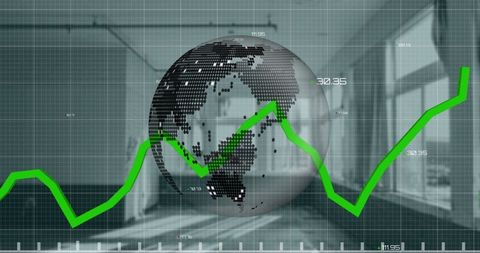
- Global Business Growth and Data Visualization with Digital Graphs
Global Business Growth and Data Visualization with Digital Graphs Image

Digitally generated visualization features graphs and changing numbers forming a globe. Represents trends, growth, and communication in global businesses. Useful for presentations on data analytics, financial markets, or technological advancements in globalization.
Powered by  - Get 15% off with code: PIKWIZARD15


downloads
Tags:
More
Credit Photo
If you would like to credit the Photo, here are some ways you can do so
Text Link
photo Link
<span class="text-link">
<span>
<a target="_blank" href=https://pikwizard.com/photo/global-business-growth-and-data-visualization-with-digital-graphs/a205f387b453445b7788d5aad4d0e92f/>PikWizard</a>
</span>
</span>
<span class="image-link">
<span
style="margin: 0 0 20px 0; display: inline-block; vertical-align: middle; width: 100%;"
>
<a
target="_blank"
href="https://pikwizard.com/photo/global-business-growth-and-data-visualization-with-digital-graphs/a205f387b453445b7788d5aad4d0e92f/"
style="text-decoration: none; font-size: 10px; margin: 0;"
>
<img src="https://pikwizard.com/pw/medium/a205f387b453445b7788d5aad4d0e92f.jpg" style="margin: 0; width: 100%;" alt="" />
<p style="font-size: 12px; margin: 0;">PikWizard</p>
</a>
</span>
</span>
Free (free of charge)
Free for personal and commercial use.
Author: Awesome Content
Similar Free Stock Images
Loading...

Premium


Premium

Premium


Premium


Premium


Premium


Premium


Premium


Premium

Premium


Premium


Premium


Premium


Premium


Premium


Premium


Premium


Premium


Premium


Premium

Premium


Premium


Premium


Premium


Premium

Explore More Free Stock Images