- Home >
- Stock Photos >
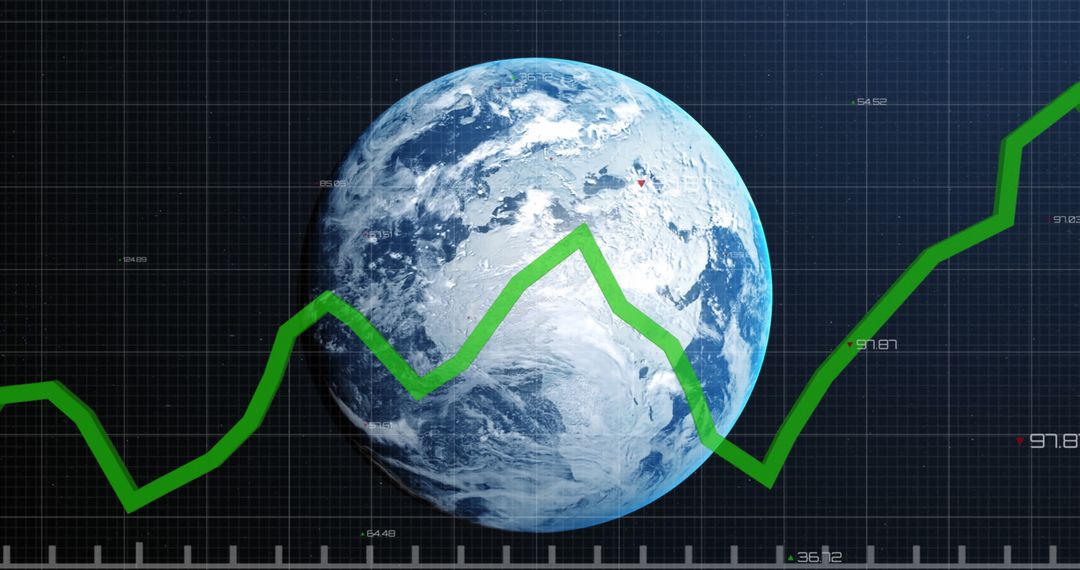
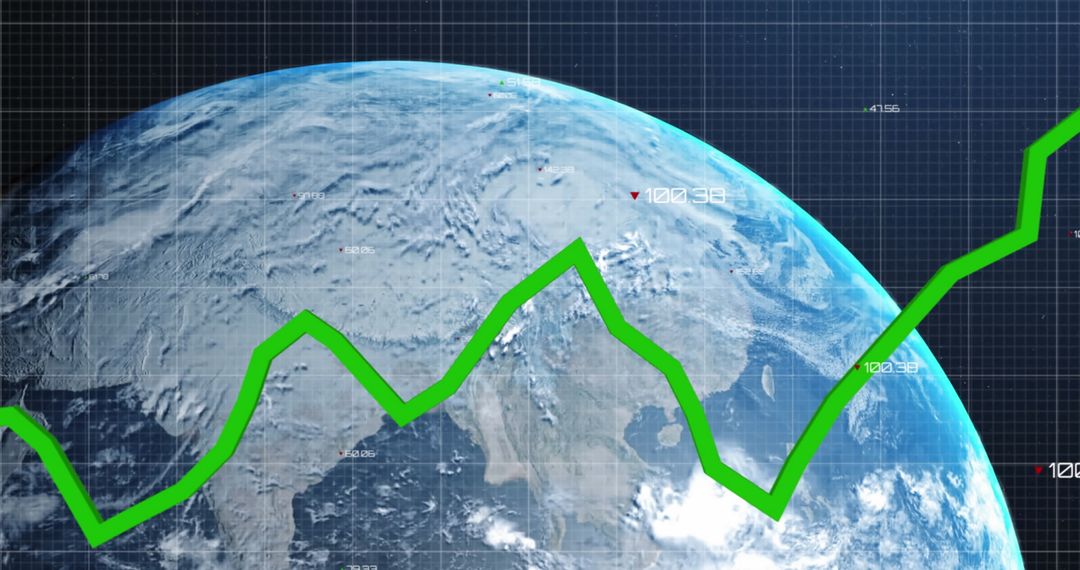
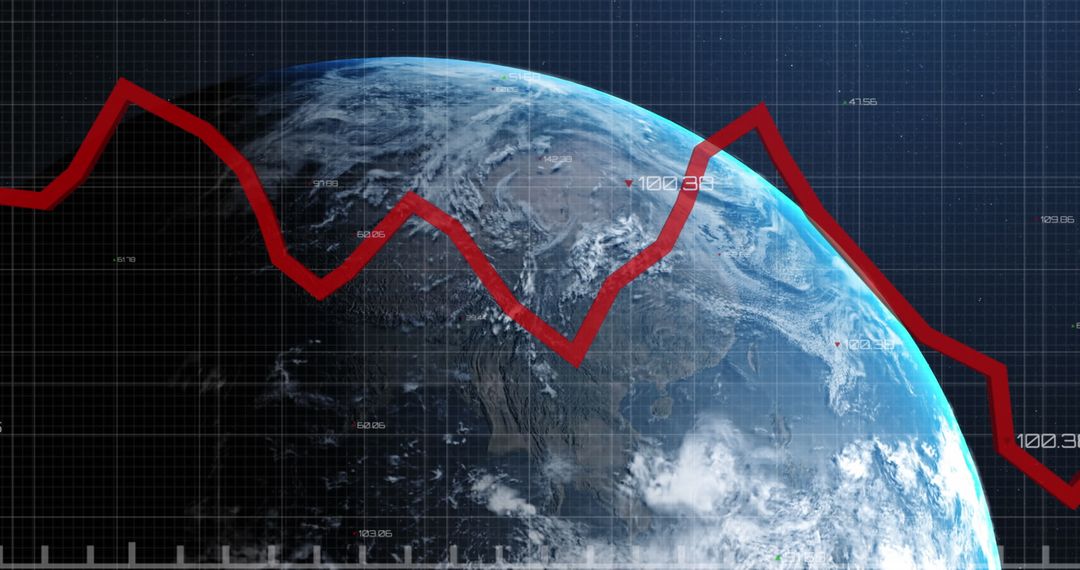
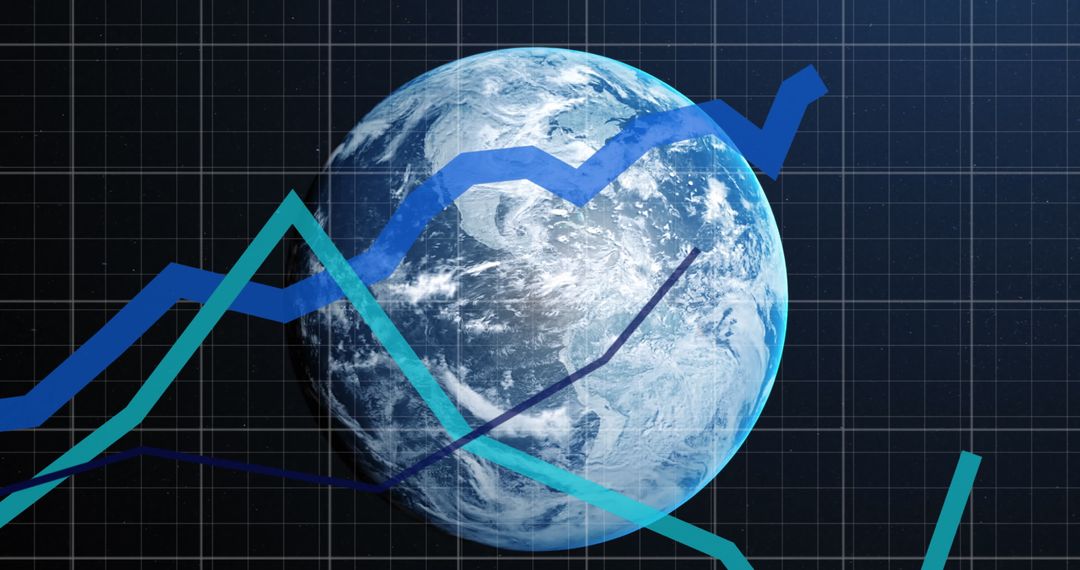
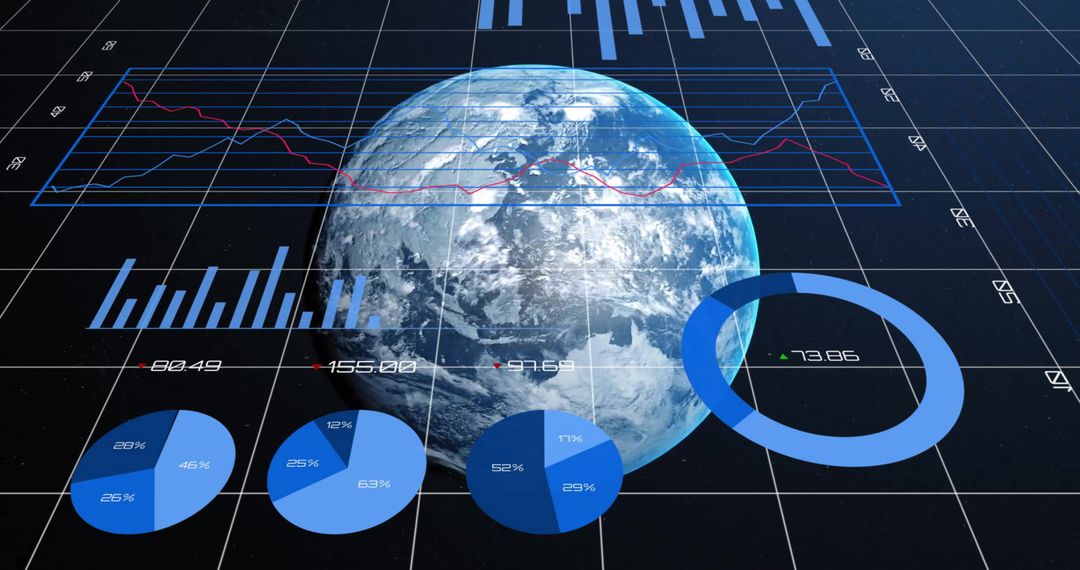
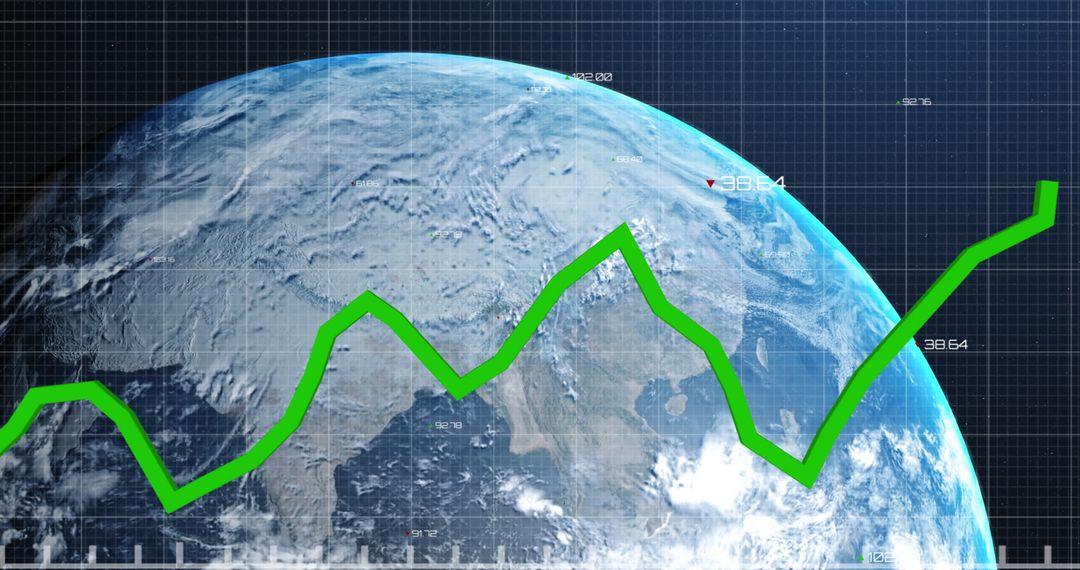
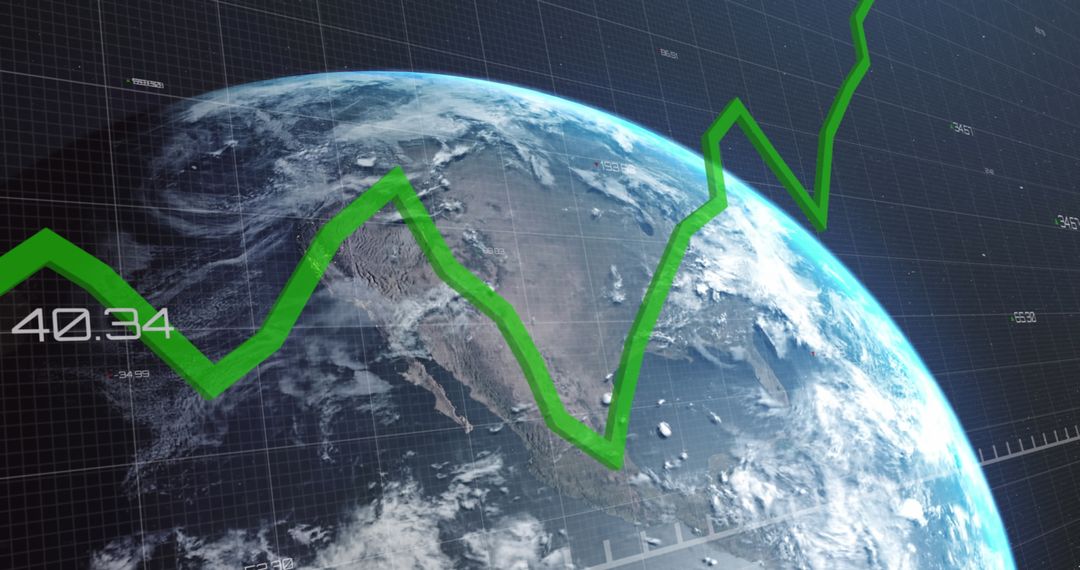
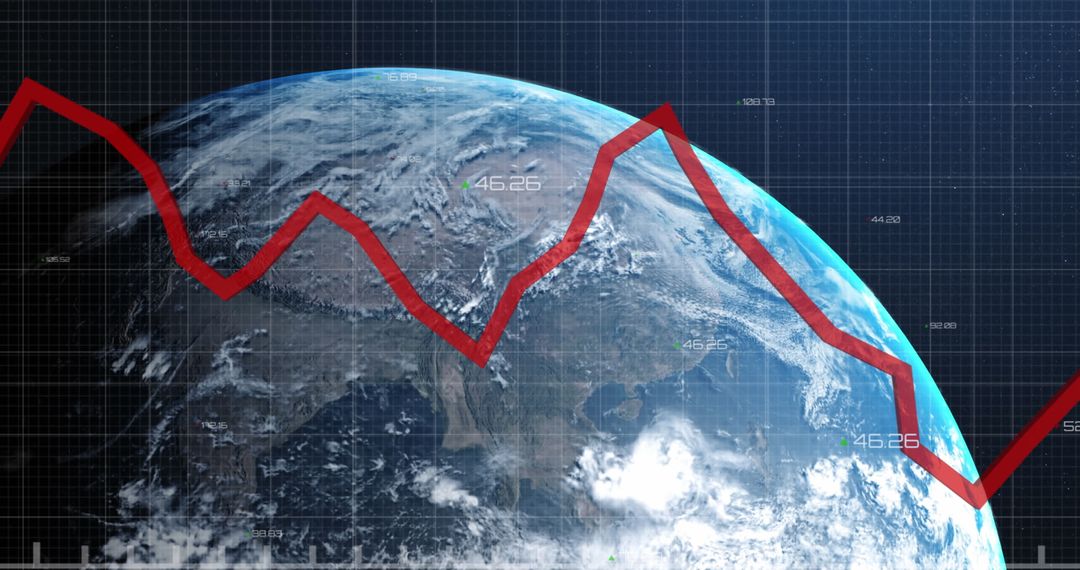
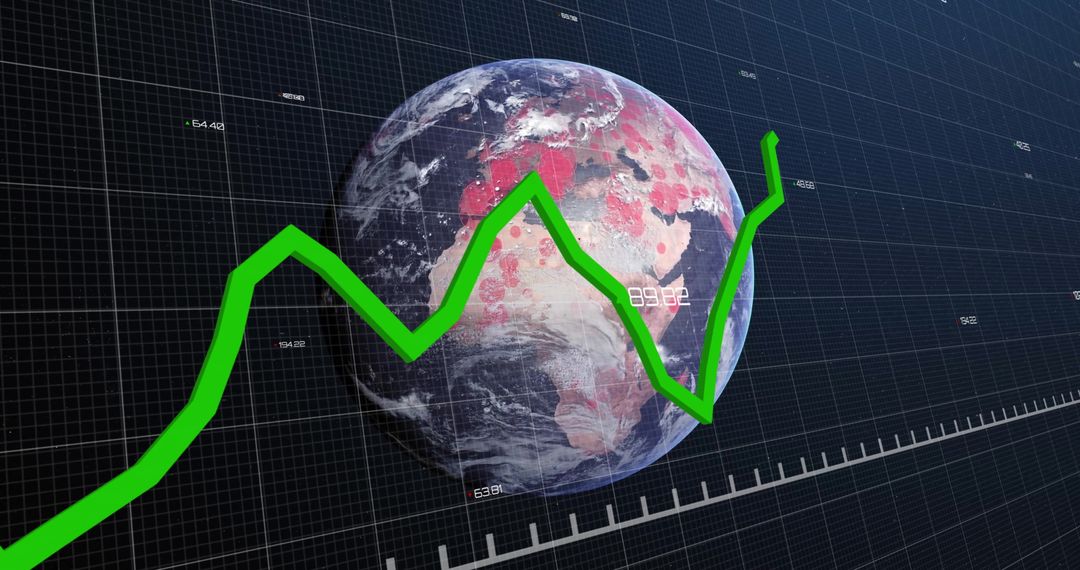
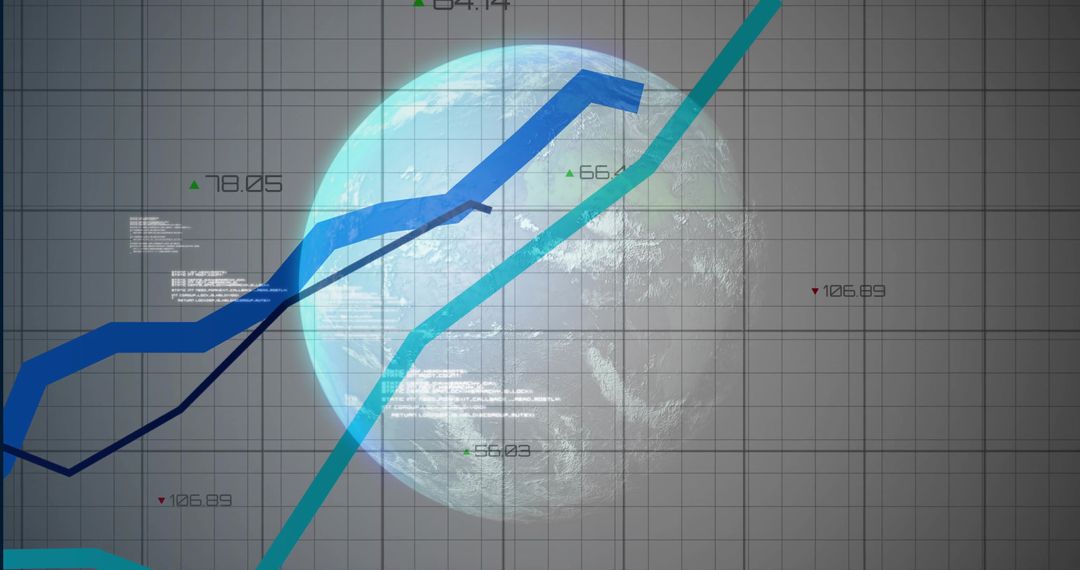
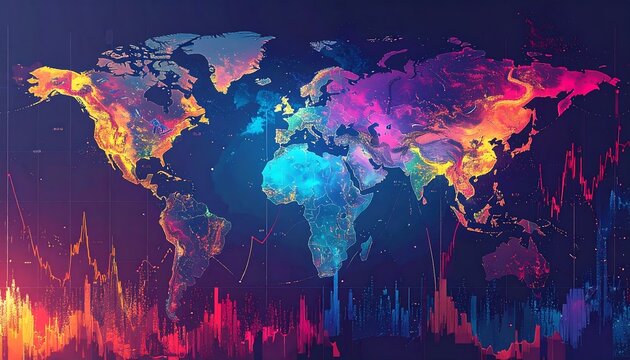
- Global Business Growth Trends with Graph Data
Global Business Growth Trends with Graph Data Image

Dynamic representation of global business growth using colorful graphs overlaid on a depiction of Earth amidst a dark grid background. This visual captures the concept of financial growth and globalization. Ideal for use in business presentations, economic reports, and articles related to global market trends.
Powered by 


2
downloads
downloads
Tags:
More
Credit Photo
If you would like to credit the Photo, here are some ways you can do so
Text Link
photo Link
<span class="text-link">
<span>
<a target="_blank" href=https://pikwizard.com/photo/global-business-growth-trends-with-graph-data/19689ab4ba84e5fc3d4bfc8da33542d0/>PikWizard</a>
</span>
</span>
<span class="image-link">
<span
style="margin: 0 0 20px 0; display: inline-block; vertical-align: middle; width: 100%;"
>
<a
target="_blank"
href="https://pikwizard.com/photo/global-business-growth-trends-with-graph-data/19689ab4ba84e5fc3d4bfc8da33542d0/"
style="text-decoration: none; font-size: 10px; margin: 0;"
>
<img src="https://pikwizard.com/pw/medium/19689ab4ba84e5fc3d4bfc8da33542d0.jpg" style="margin: 0; width: 100%;" alt="" />
<p style="font-size: 12px; margin: 0;">PikWizard</p>
</a>
</span>
</span>
Free (free of charge)
Free for personal and commercial use.
Author: Authentic Images
Similar Free Stock Images

Premium


Premium


Premium


Premium


Premium


Premium


Premium


Premium


Premium


Premium


Premium


Premium


Premium


Premium


Premium


Premium


Premium


Premium


Premium


Premium


Premium


Premium


Premium


Premium