
- Home >
- Stock Photos >
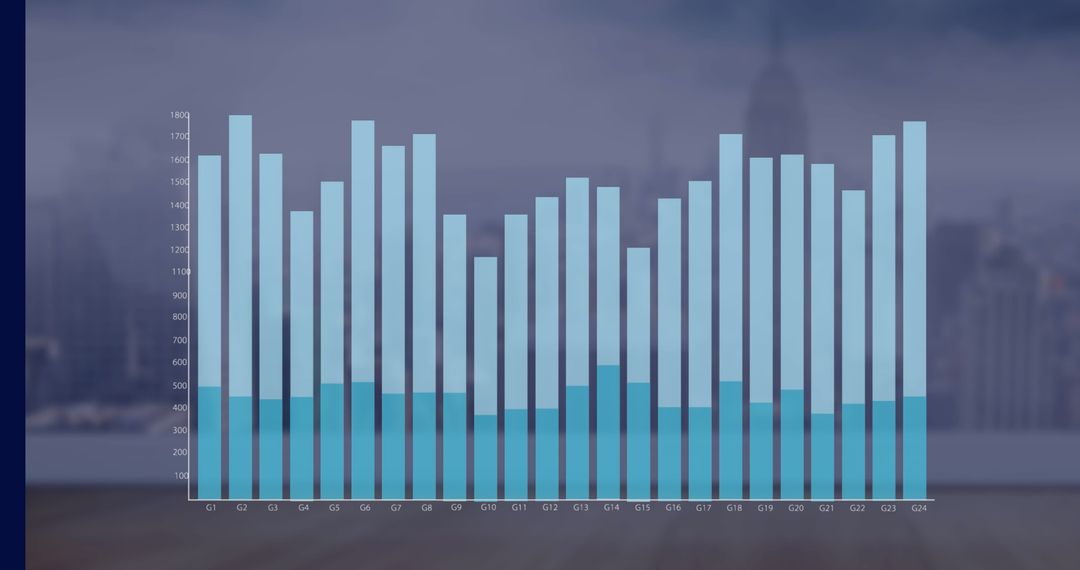
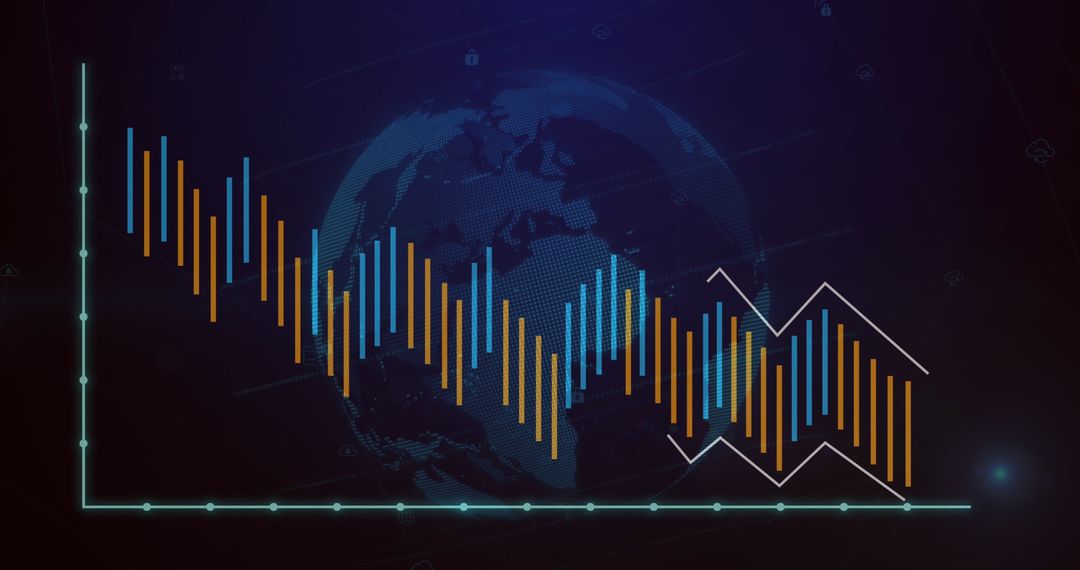
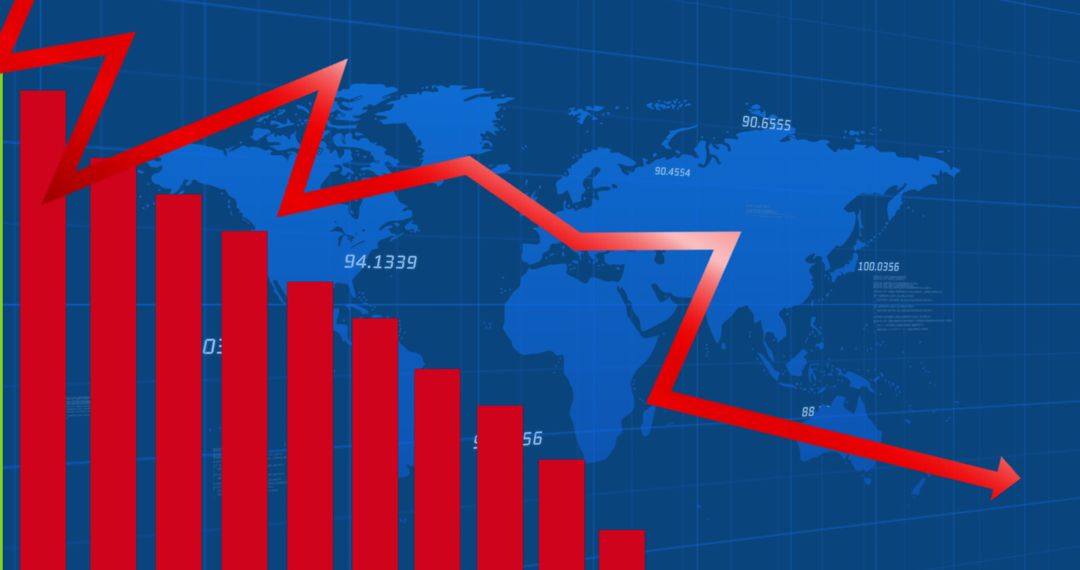
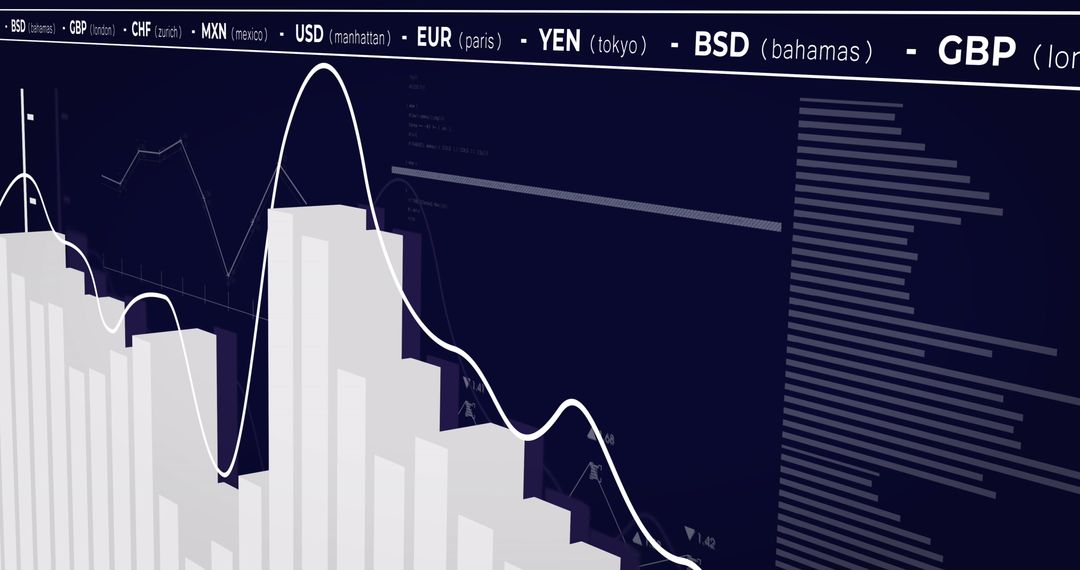
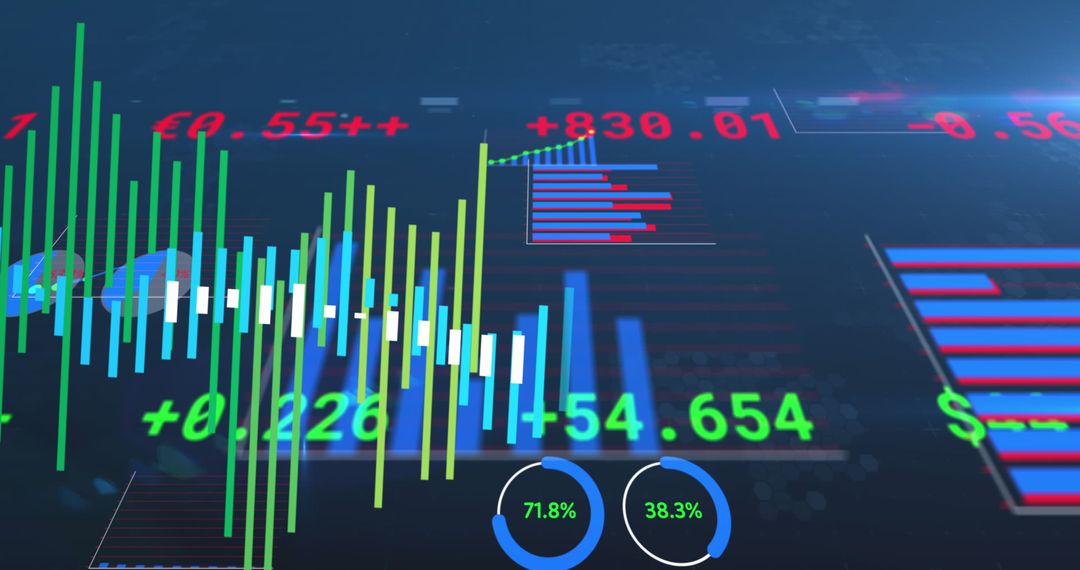
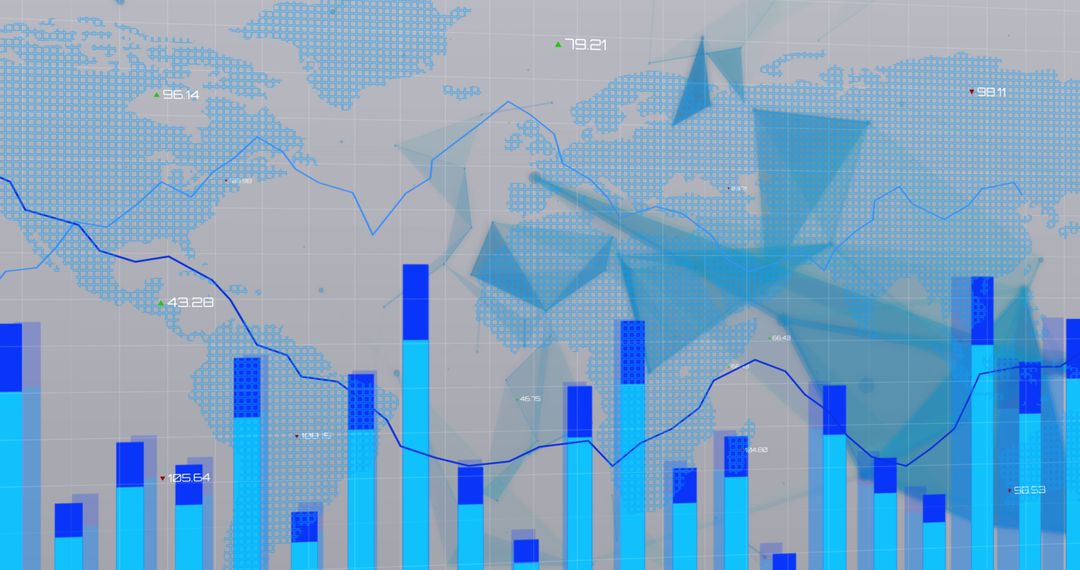
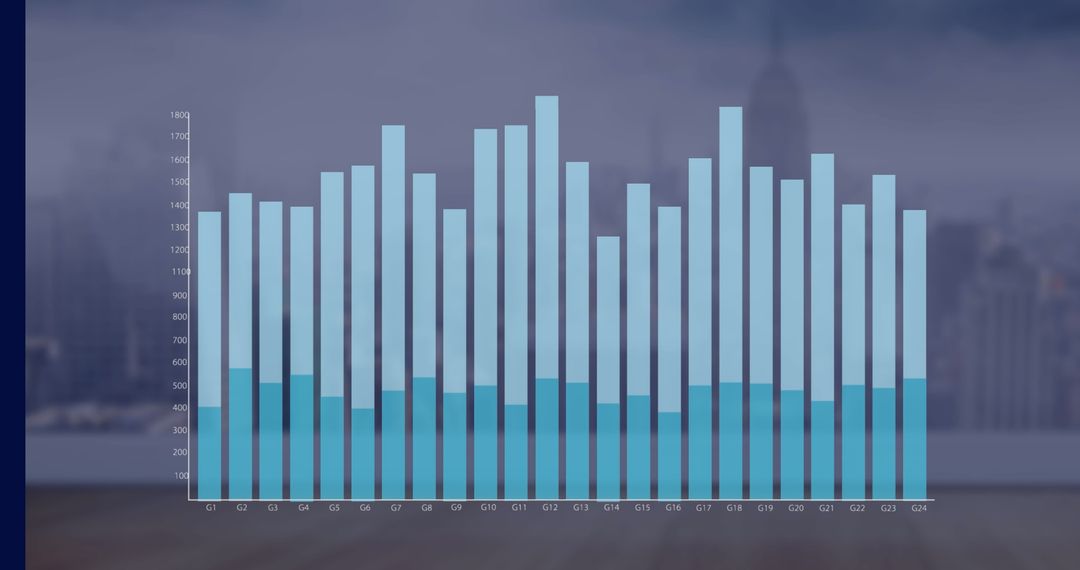
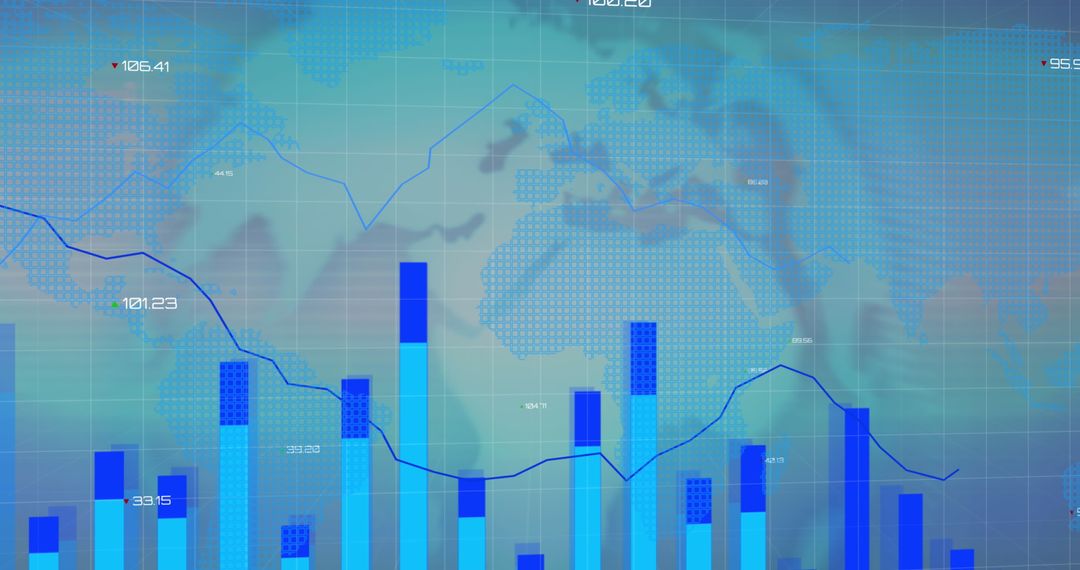
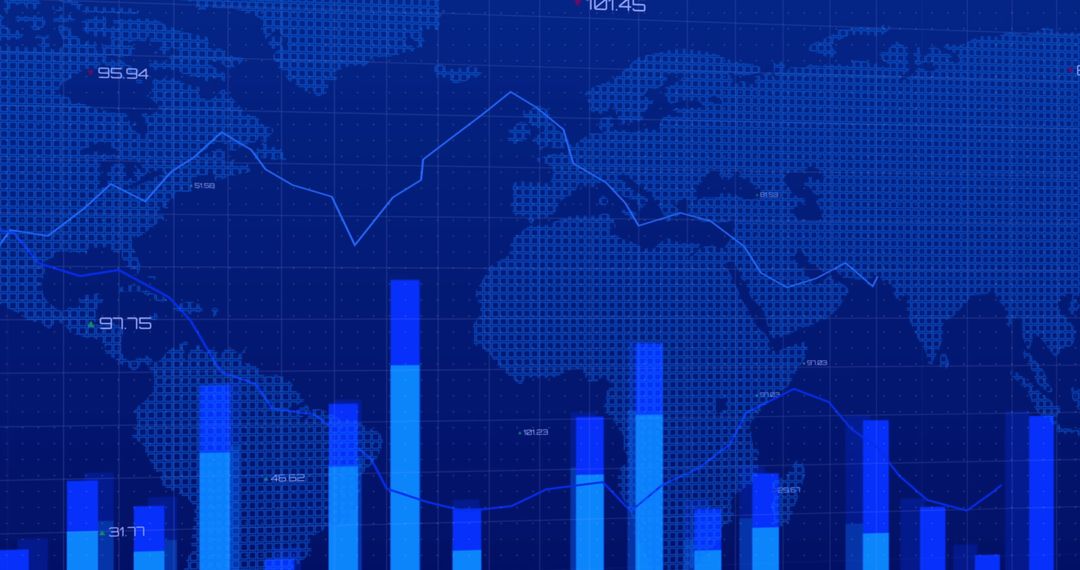
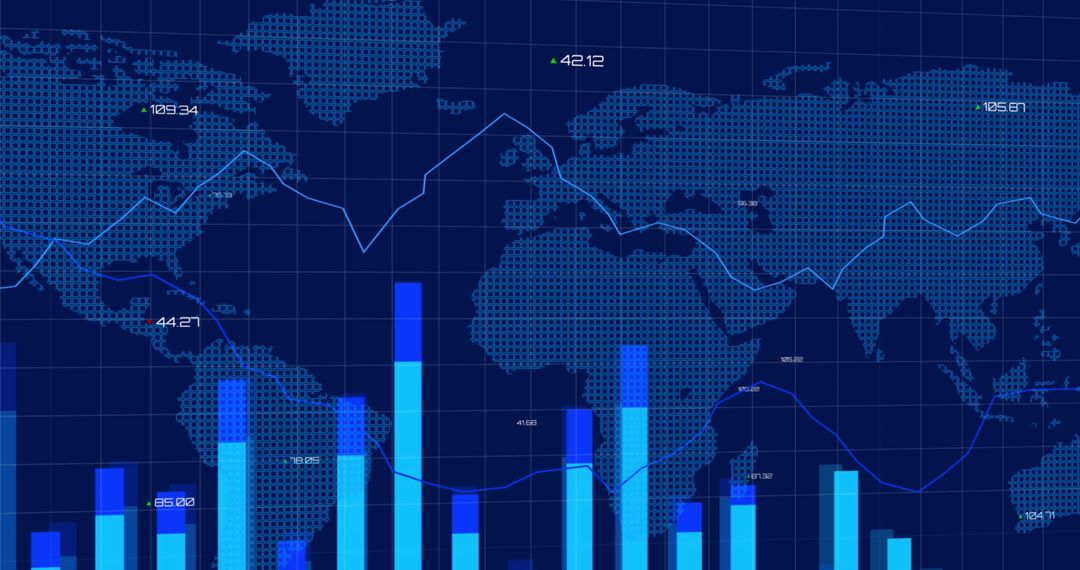
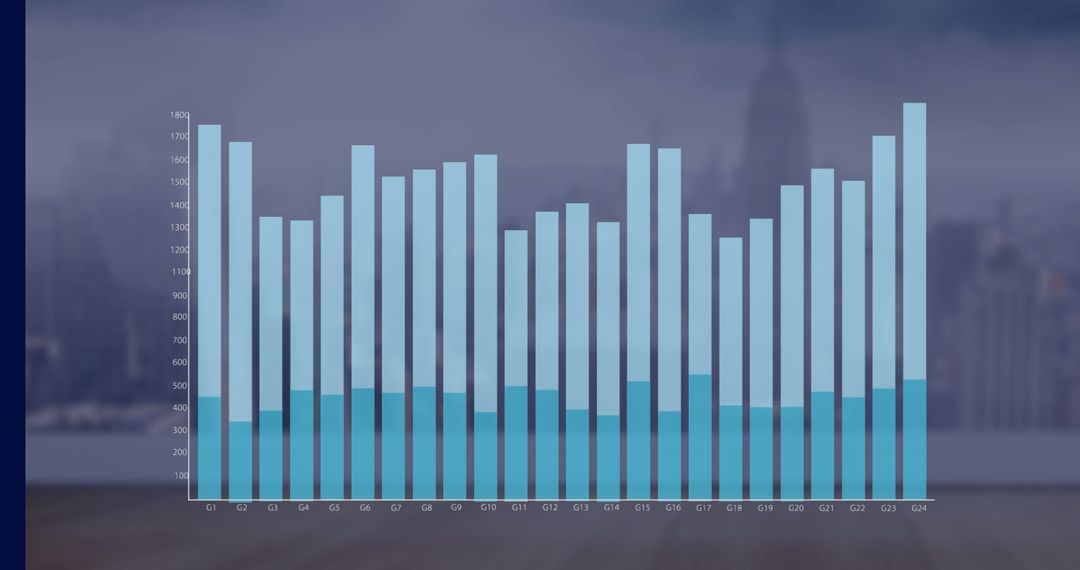
- Global Business Growth with Statistical Graphs and World Map Background
Global Business Growth with Statistical Graphs and World Map Background Image

Features data graphs on a digital world map backdrop, symbolizing global business trends and growth. Excellent for illustrating concepts in finance, economics, or global technology presentations. Suitable for websites discussing international business strategies or data analysis tools.
Powered by 


4
downloads
downloads
Tags:
More
Credit Photo
If you would like to credit the Photo, here are some ways you can do so
Text Link
photo Link
<span class="text-link">
<span>
<a target="_blank" href=https://pikwizard.com/photo/global-business-growth-with-statistical-graphs-and-world-map-background/d613583e65b4d4f7326a6339c9304cc5/>PikWizard</a>
</span>
</span>
<span class="image-link">
<span
style="margin: 0 0 20px 0; display: inline-block; vertical-align: middle; width: 100%;"
>
<a
target="_blank"
href="https://pikwizard.com/photo/global-business-growth-with-statistical-graphs-and-world-map-background/d613583e65b4d4f7326a6339c9304cc5/"
style="text-decoration: none; font-size: 10px; margin: 0;"
>
<img src="https://pikwizard.com/pw/medium/d613583e65b4d4f7326a6339c9304cc5.jpg" style="margin: 0; width: 100%;" alt="" />
<p style="font-size: 12px; margin: 0;">PikWizard</p>
</a>
</span>
</span>
Free (free of charge)
Free for personal and commercial use.
Author: Creative Art
Similar Free Stock Images

Premium


Premium


Premium


Premium


Premium


Premium


Premium


Premium


Premium


Premium


Premium


Premium


Premium


Premium


Premium


Premium


Premium


Premium


Premium


Premium


Premium


Premium


Premium


Premium

