- Home >
- Stock Photos >
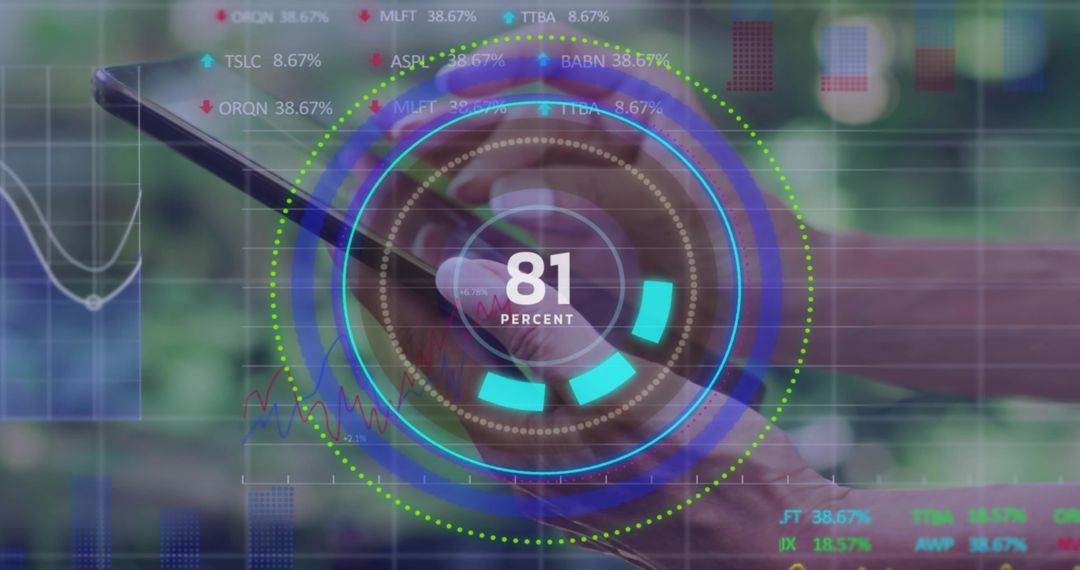
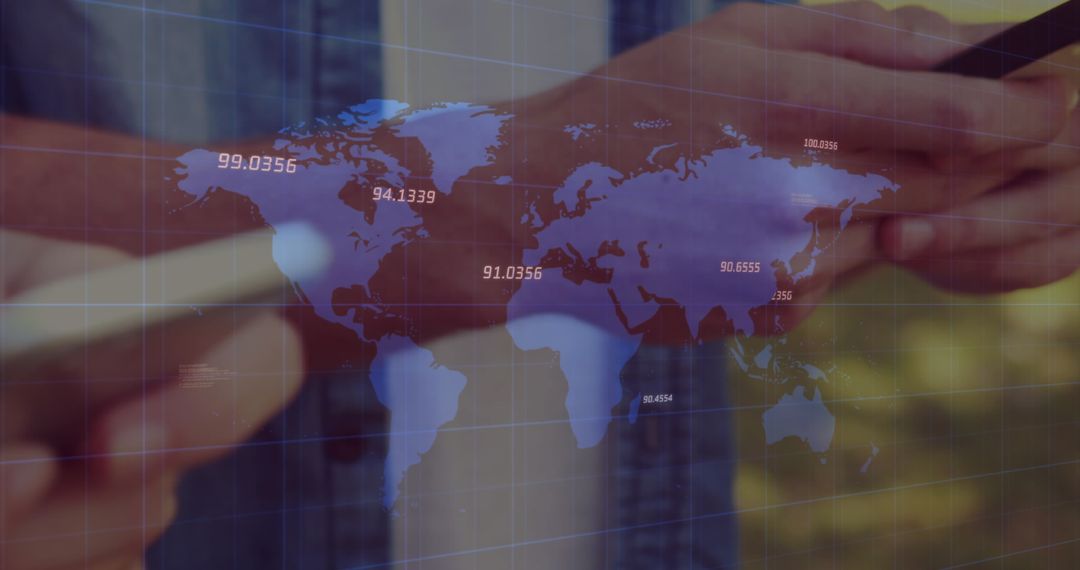
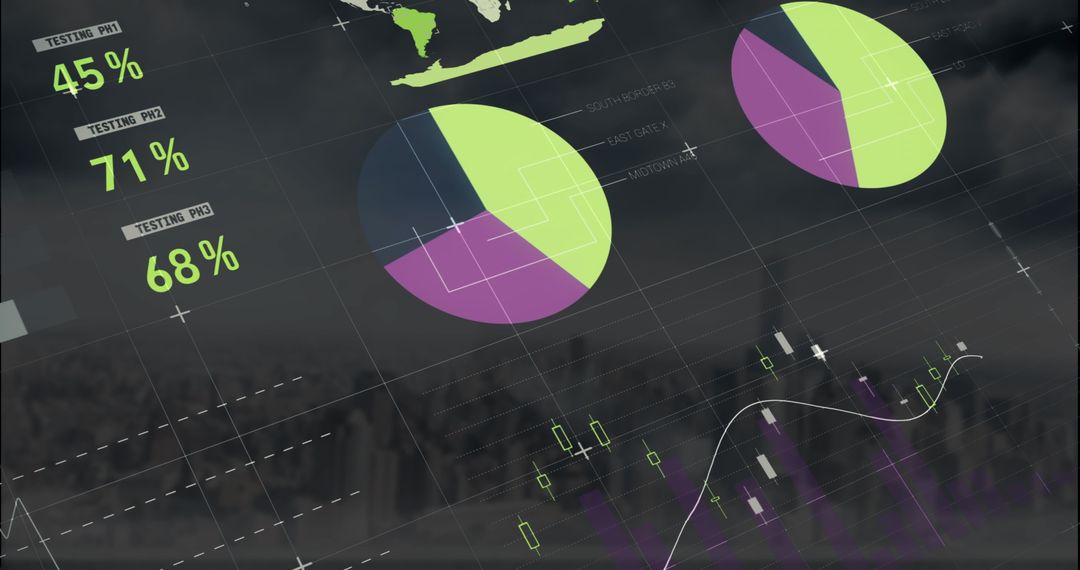
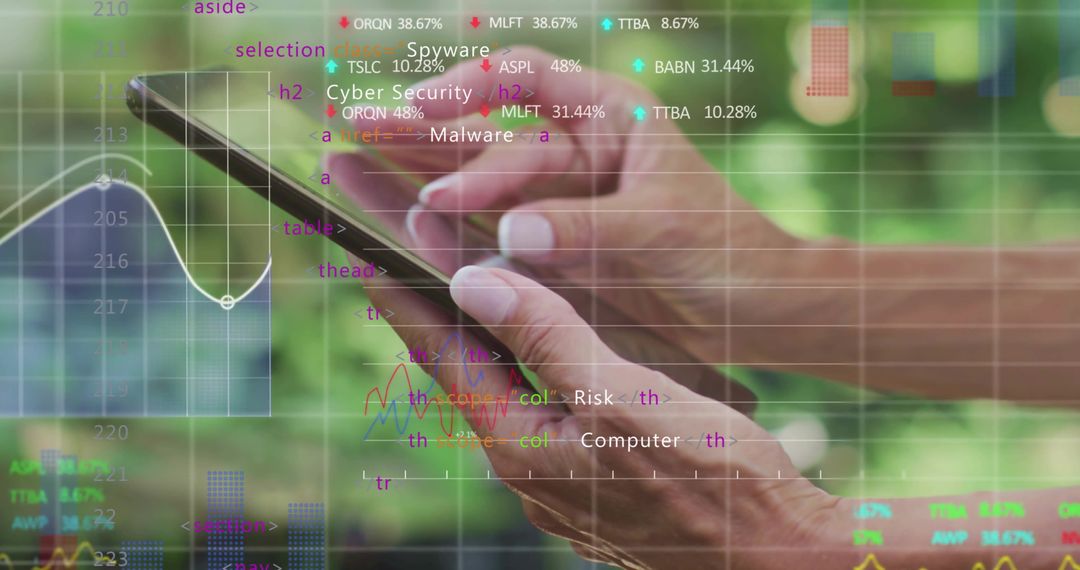
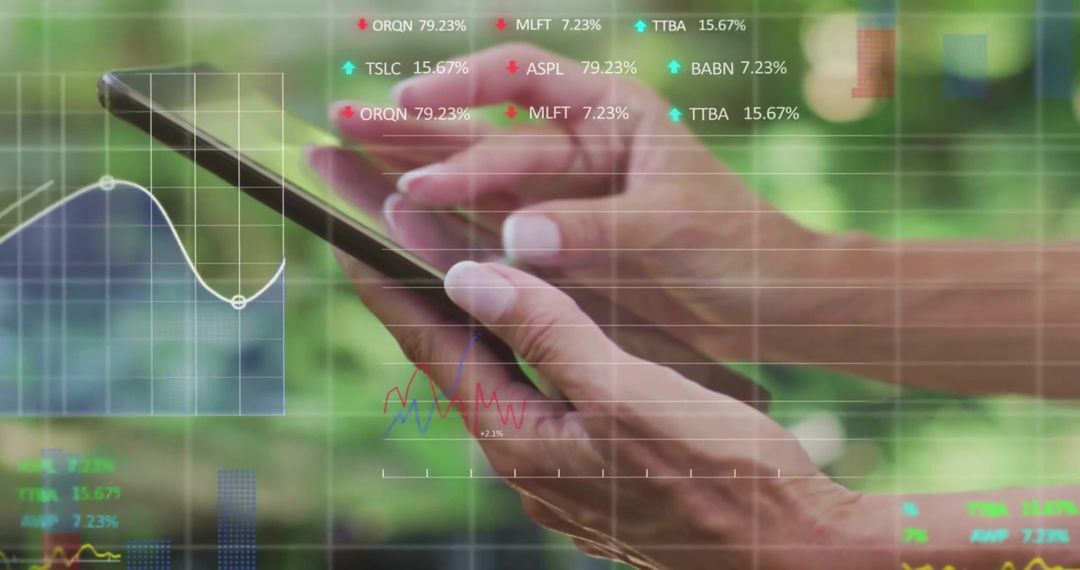
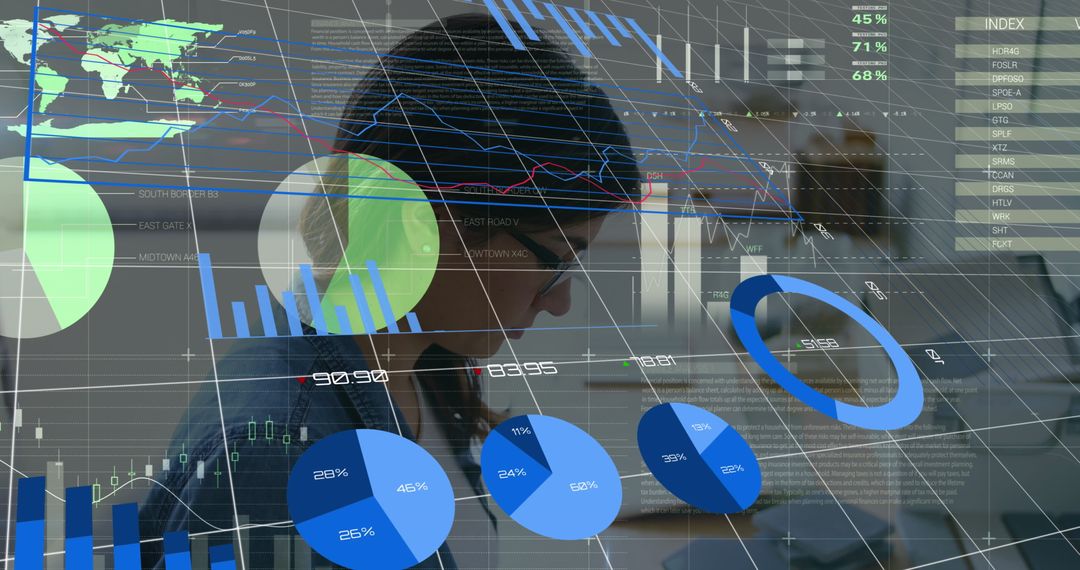
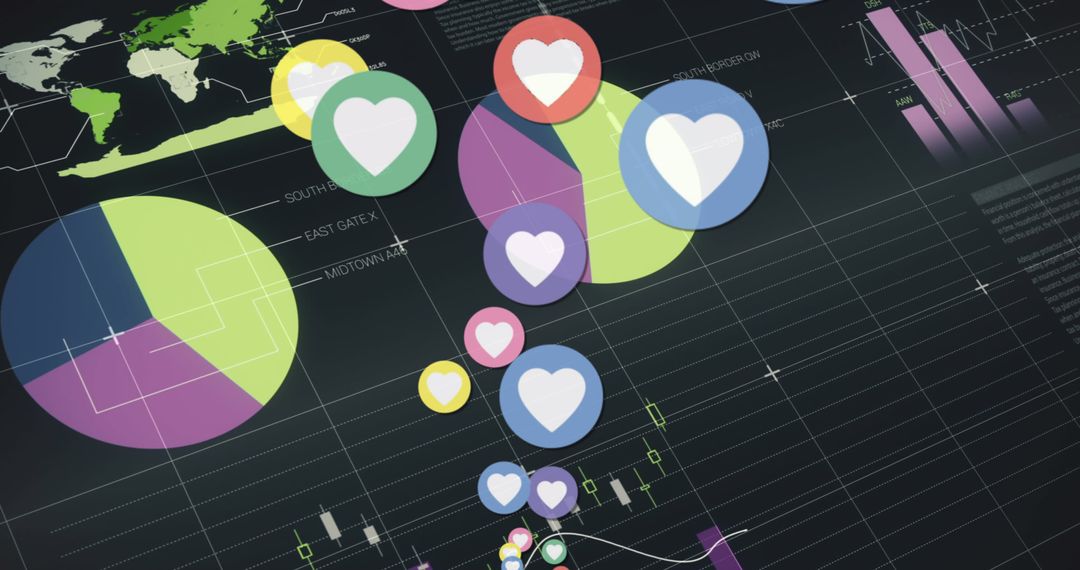
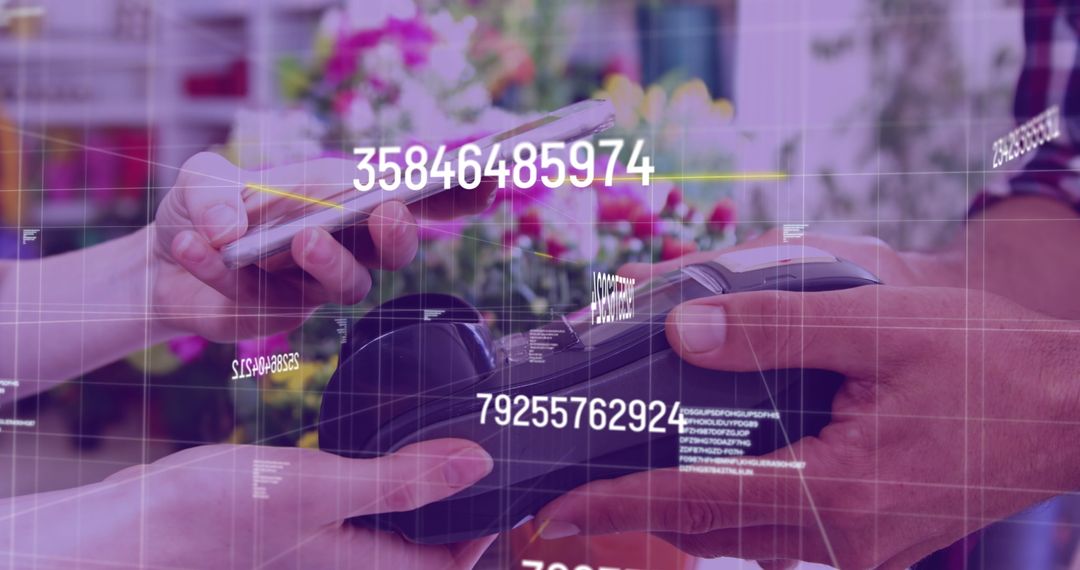
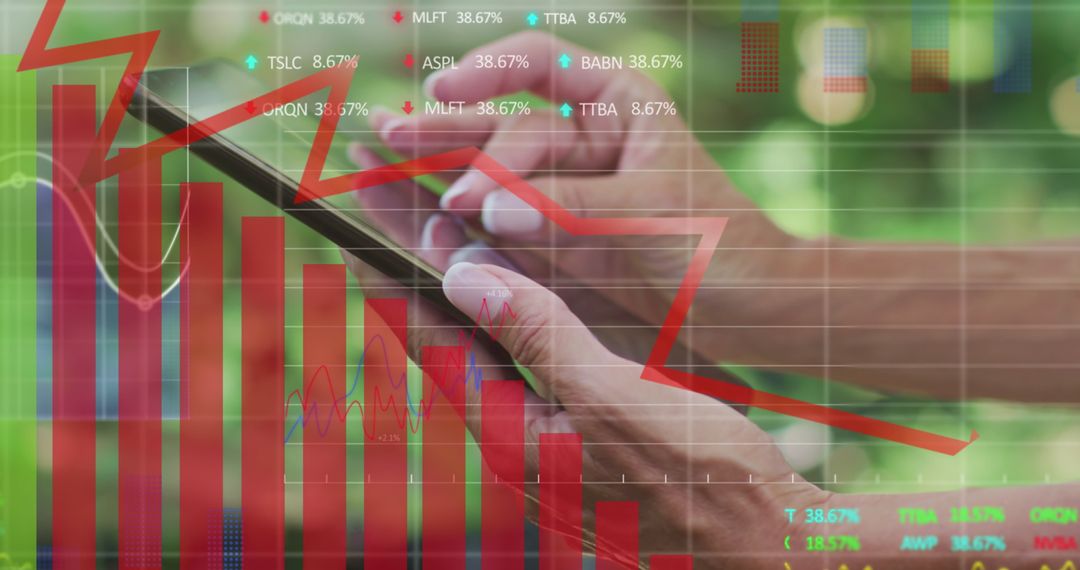
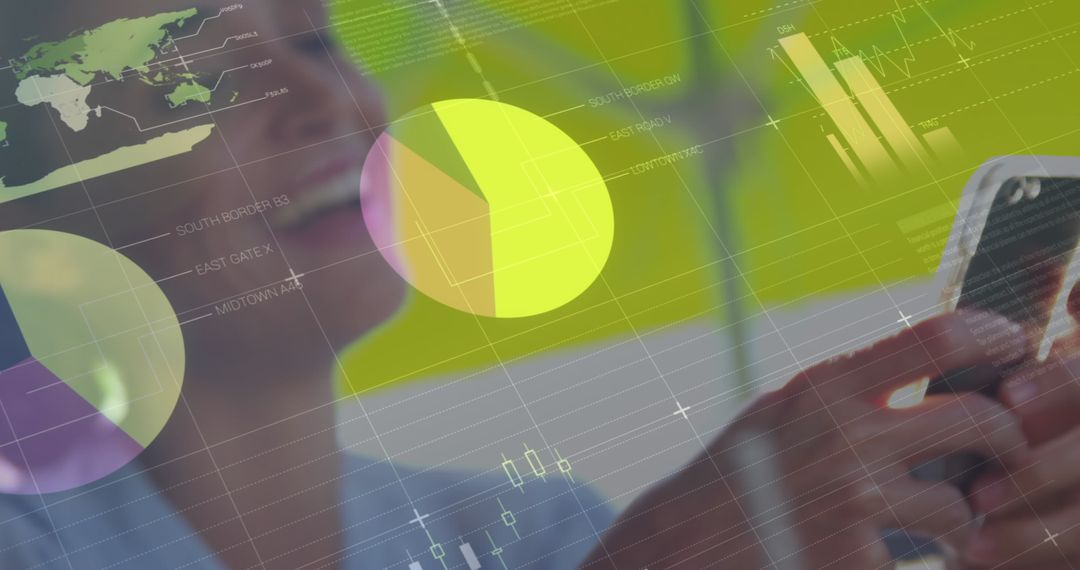
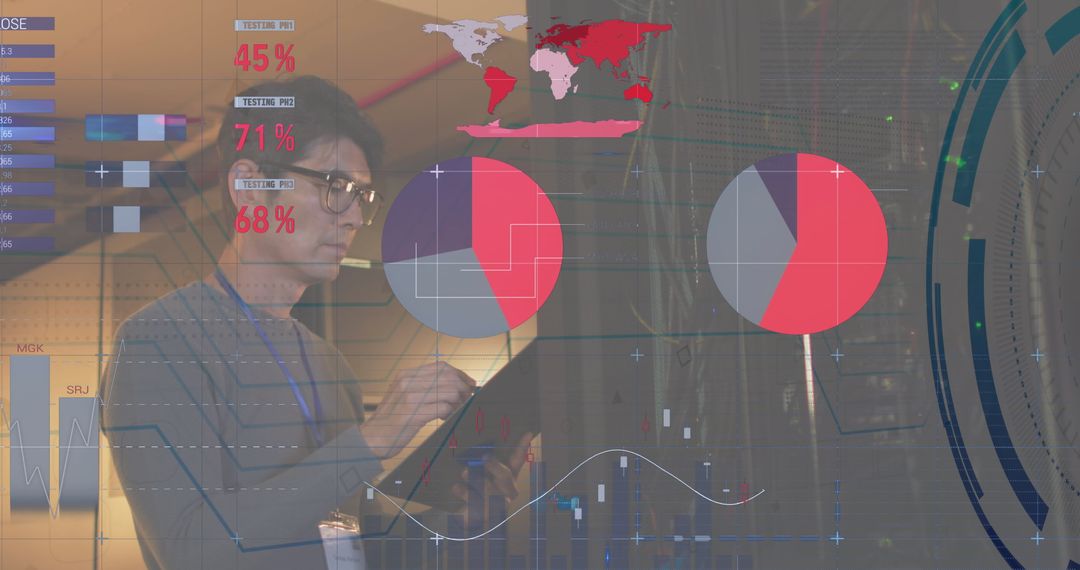
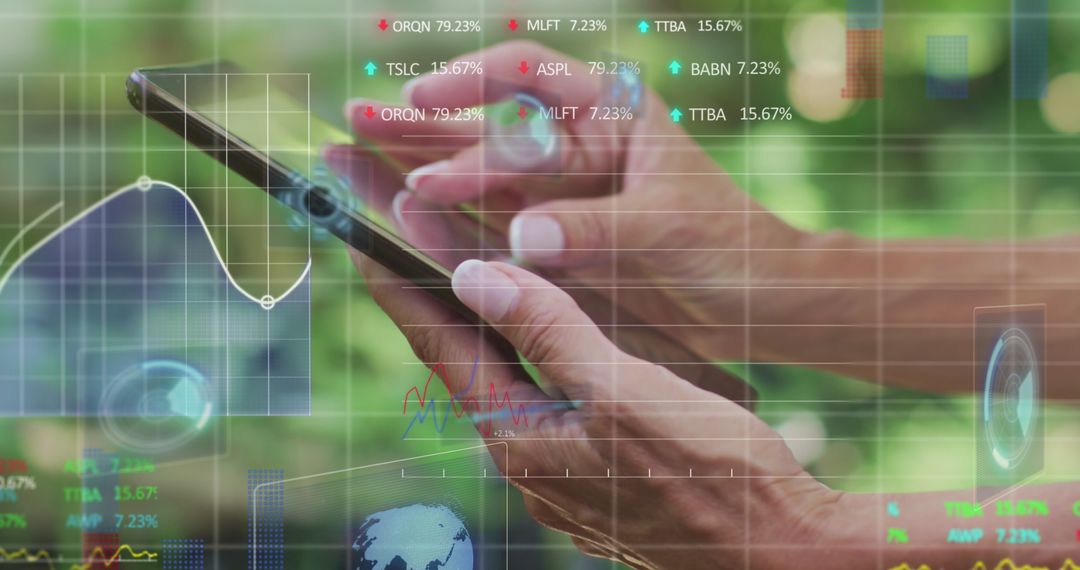
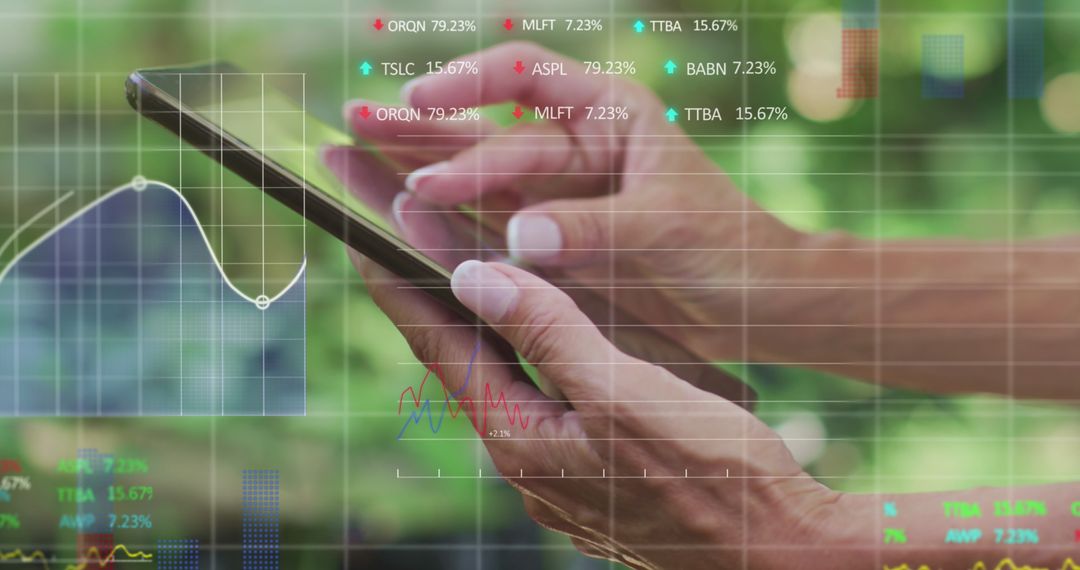
- Global Business Technology with Data Analysis Overlays
Global Business Technology with Data Analysis Overlays Image
Visual depicting hands interacting with smartphone surrounded by digital charts and data graphics conveys innovation in global business and technology. Useful for illustrating concepts of data technology, global transactions, digital interfaces, financial analysis, and network connectivity in the digital economy. Ideal for presentations, educational materials, business articles, and financial forecasts.
Powered by 


2
downloads
downloads
Tags:
More
Credit Photo
If you would like to credit the Photo, here are some ways you can do so
Text Link
photo Link
<span class="text-link">
<span>
<a target="_blank" href=https://pikwizard.com/photo/global-business-technology-with-data-analysis-overlays/4694f83107756a259d39b3b7b13d01a7/>PikWizard</a>
</span>
</span>
<span class="image-link">
<span
style="margin: 0 0 20px 0; display: inline-block; vertical-align: middle; width: 100%;"
>
<a
target="_blank"
href="https://pikwizard.com/photo/global-business-technology-with-data-analysis-overlays/4694f83107756a259d39b3b7b13d01a7/"
style="text-decoration: none; font-size: 10px; margin: 0;"
>
<img src="https://pikwizard.com/pw/medium/4694f83107756a259d39b3b7b13d01a7.jpg" style="margin: 0; width: 100%;" alt="" />
<p style="font-size: 12px; margin: 0;">PikWizard</p>
</a>
</span>
</span>
Free (free of charge)
Free for personal and commercial use.
Author: Creative Art
Similar Free Stock Images

Premium


Premium


Premium


Premium


Premium


Premium


Premium


Premium


Premium


Premium


Premium


Premium


Premium


Premium


Premium


Premium


Premium


Premium


Premium


Premium


Premium


Premium


Premium


Premium