
- Home >
- Stock Photos >
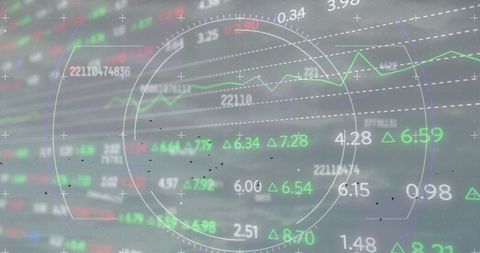
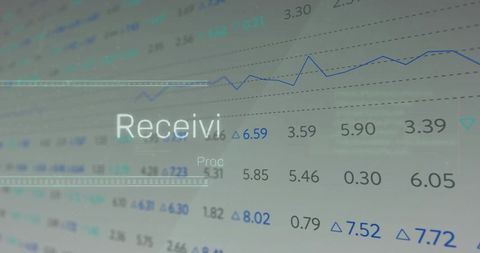
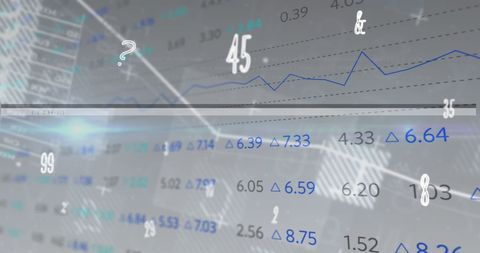
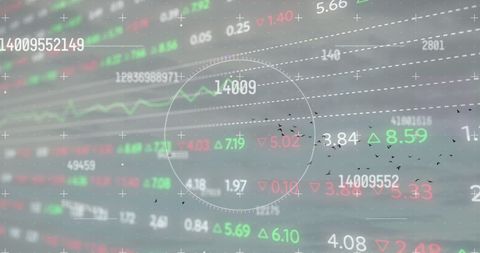
- Global Communication and Market Trends in Business Analytics
Global Communication and Market Trends in Business Analytics Image

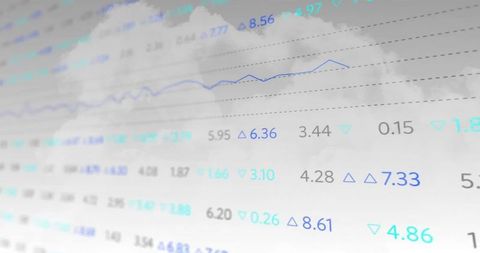
Digital abstract featuring graphs and icons representing connectivity in modern business. Highlights data analysis and trend management in industries worldwide. Ideal for presentations on business analytics, global trends, financial technology advancements, and educational content detailing how data propels strategic decisions.
Powered by  - Get 15% off with code: PIKWIZARD15


2
downloads
downloads
Tags:
More
Credit Photo
If you would like to credit the Photo, here are some ways you can do so
Text Link
photo Link
<span class="text-link">
<span>
<a target="_blank" href=https://pikwizard.com/photo/global-communication-and-market-trends-in-business-analytics/458df940af3bc189f093683e4c5e1831/>PikWizard</a>
</span>
</span>
<span class="image-link">
<span
style="margin: 0 0 20px 0; display: inline-block; vertical-align: middle; width: 100%;"
>
<a
target="_blank"
href="https://pikwizard.com/photo/global-communication-and-market-trends-in-business-analytics/458df940af3bc189f093683e4c5e1831/"
style="text-decoration: none; font-size: 10px; margin: 0;"
>
<img src="https://pikwizard.com/pw/medium/458df940af3bc189f093683e4c5e1831.jpg" style="margin: 0; width: 100%;" alt="" />
<p style="font-size: 12px; margin: 0;">PikWizard</p>
</a>
</span>
</span>
Free (free of charge)
Free for personal and commercial use.
Author: People Creations
Similar Free Stock Images
Loading...

Premium


Premium


Premium


Premium


Premium

Premium

Premium

Premium


Premium


Premium


Premium


Premium

Premium

Premium


Premium

Premium


Premium


Premium


Premium


Premium


Premium


Premium


Premium


Premium


Premium
