
- Home >
- Stock Photos >
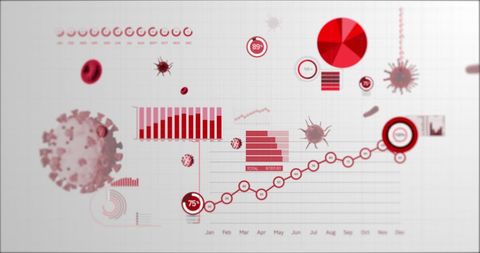
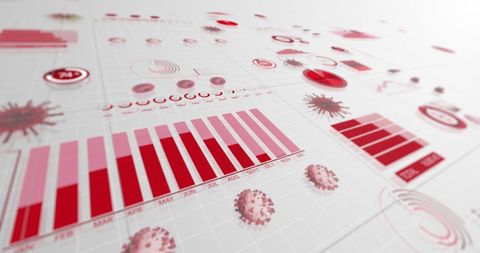
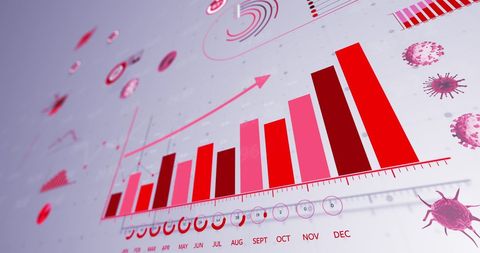
- Global COVID-19 Data Visualization with Red Bar Graph
Global COVID-19 Data Visualization with Red Bar Graph Image

This conceptual design portrays the spread and impact of COVID-19 through vivid data visualizations and graphs against a white world map background. Highlighting statistical elements and virus imagery, it serves well in educational materials and presentations focused on data analysis, healthcare trends, pandemic studies, and global health reports.
Powered by  - Get 15% off with code: PIKWIZARD15


downloads
Tags:
More
Credit Photo
If you would like to credit the Photo, here are some ways you can do so
Text Link
photo Link
<span class="text-link">
<span>
<a target="_blank" href=https://pikwizard.com/photo/global-covid-19-data-visualization-with-red-bar-graph/b1bbfc32ad2db65297f5362fa3f4bae2/>PikWizard</a>
</span>
</span>
<span class="image-link">
<span
style="margin: 0 0 20px 0; display: inline-block; vertical-align: middle; width: 100%;"
>
<a
target="_blank"
href="https://pikwizard.com/photo/global-covid-19-data-visualization-with-red-bar-graph/b1bbfc32ad2db65297f5362fa3f4bae2/"
style="text-decoration: none; font-size: 10px; margin: 0;"
>
<img src="https://pikwizard.com/pw/medium/b1bbfc32ad2db65297f5362fa3f4bae2.jpg" style="margin: 0; width: 100%;" alt="" />
<p style="font-size: 12px; margin: 0;">PikWizard</p>
</a>
</span>
</span>
Free (free of charge)
Free for personal and commercial use.
Author: Authentic Images
Similar Free Stock Images

Premium


Premium

Premium


Premium


Premium


Premium


Premium


Premium

Premium

Premium

Premium


Premium


Premium


Premium


Premium


Premium


Premium


Premium


Premium


Premium


Premium

Premium


Premium


Premium


Premium

Explore More Free Stock Images