
- Home >
- Stock Photos >
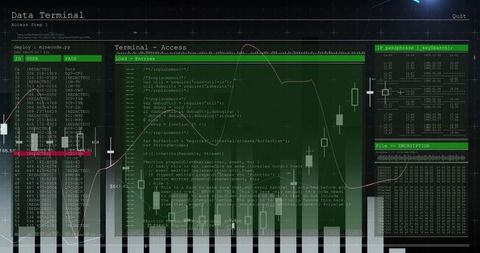
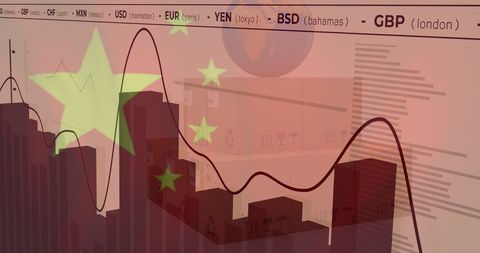
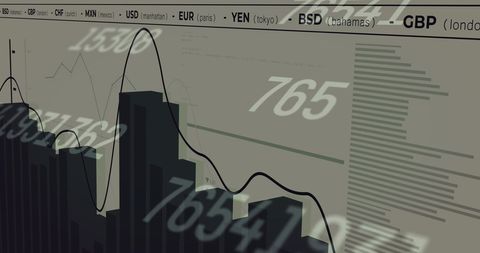
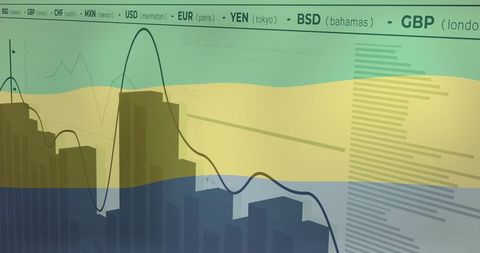
- Global Currency Charts Displaying Market Fluctuations
Global Currency Charts Displaying Market Fluctuations Image

Clear depiction of various global currencies symbols including USD, EUR, YEN, BSD and GBP combined with graphical waveplot on dark background suggests digital investment analysis and market reporting. Ideal for illustrating online finance articles, economic trend updates, professional trading presentations, or investment tool advertising.
Powered by  - Get 15% off with code: PIKWIZARD15


downloads
Tags:
More
Credit Photo
If you would like to credit the Photo, here are some ways you can do so
Text Link
photo Link
<span class="text-link">
<span>
<a target="_blank" href=https://pikwizard.com/photo/global-currency-charts-displaying-market-fluctuations/0cab3426758a2ed6213aeb4154471d98/>PikWizard</a>
</span>
</span>
<span class="image-link">
<span
style="margin: 0 0 20px 0; display: inline-block; vertical-align: middle; width: 100%;"
>
<a
target="_blank"
href="https://pikwizard.com/photo/global-currency-charts-displaying-market-fluctuations/0cab3426758a2ed6213aeb4154471d98/"
style="text-decoration: none; font-size: 10px; margin: 0;"
>
<img src="https://pikwizard.com/pw/medium/0cab3426758a2ed6213aeb4154471d98.jpg" style="margin: 0; width: 100%;" alt="" />
<p style="font-size: 12px; margin: 0;">PikWizard</p>
</a>
</span>
</span>
Free (free of charge)
Free for personal and commercial use.
Author: Awesome Content
Similar Free Stock Images
Loading...

Premium


Premium

Premium


Premium

Premium


Premium

Premium


Premium


Premium


Premium


Premium


Premium


Premium


Premium


Premium


Premium


Premium


Premium


Premium


Premium


Premium


Premium

Premium


Premium

Premium
