- Home >
- Stock Photos >
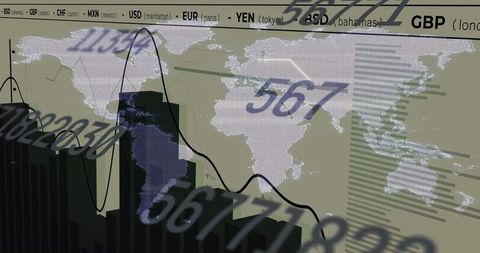
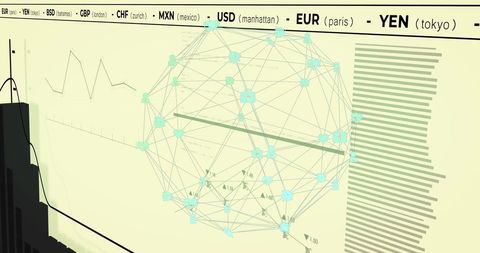
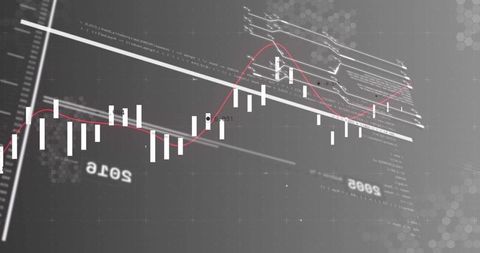
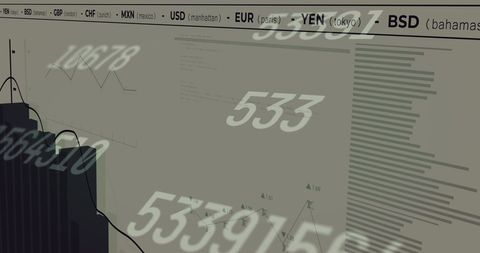
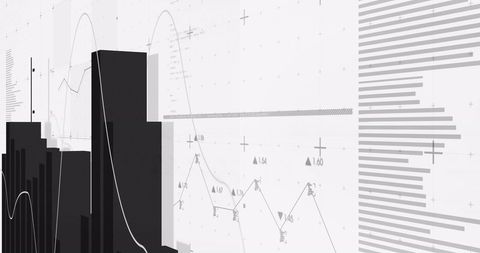
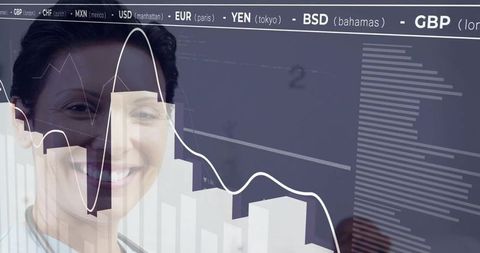
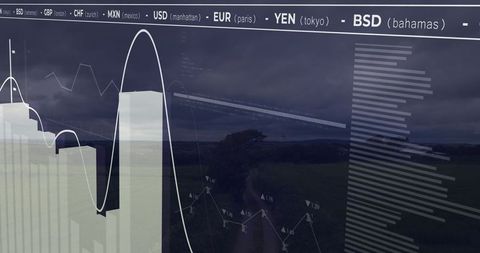
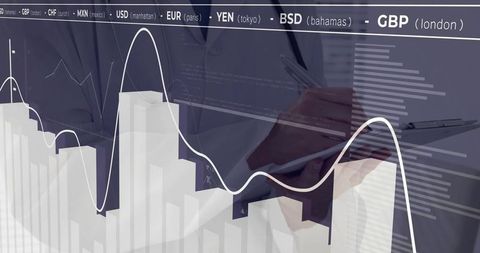
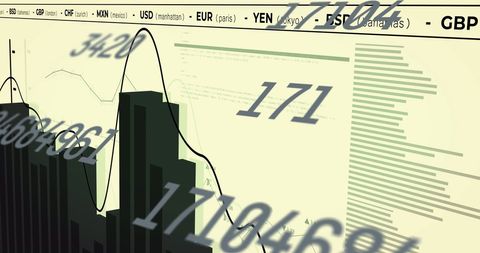
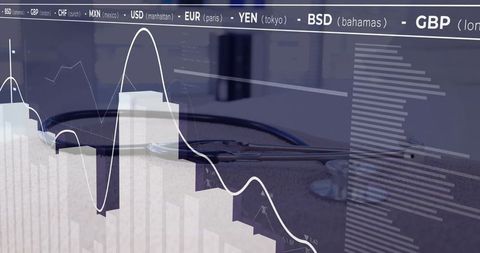
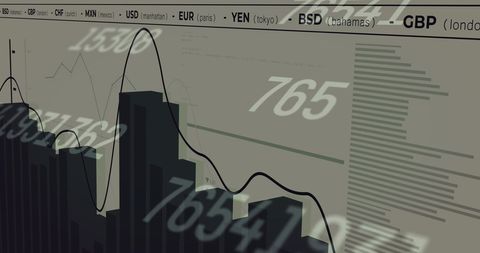
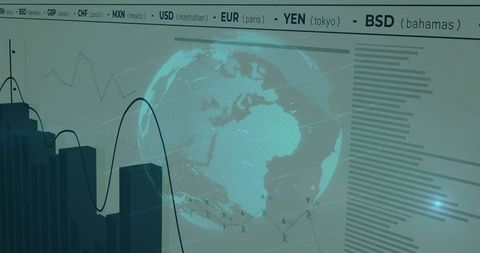
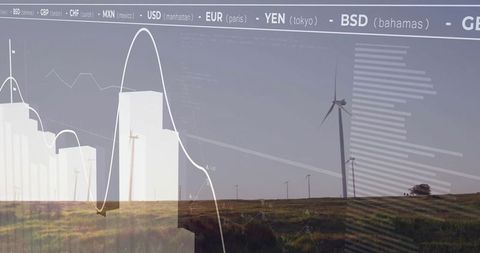
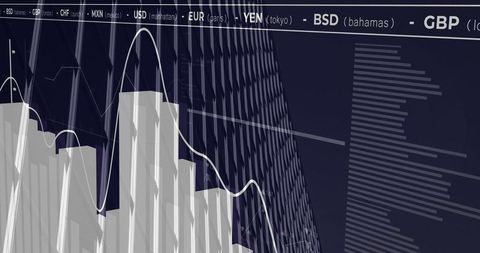
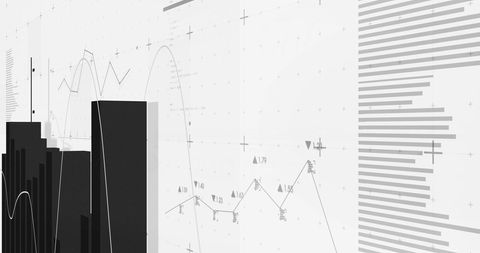
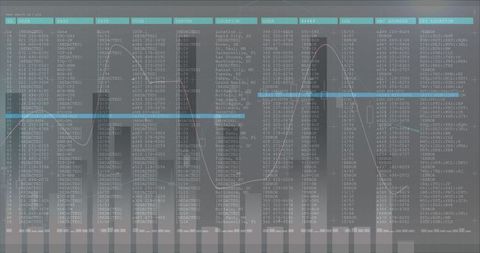
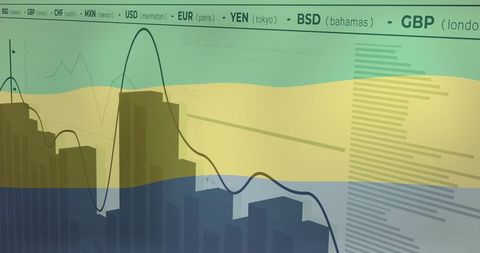
- Global Currency Data Processing Visualization
Global Currency Data Processing Visualization Image

Depiction of complex global financial data and currencies such as USD, EUR, and YEN represented over a dark background, emphasizing global connections and financial analysis. Ideal for articles or presentations focused on economic trends, currency exchange rates, or modern financial technologies.

downloads
Tags:
More
Credit Photo
If you would like to credit the Photo, here are some ways you can do so
Text Link
photo Link
<span class="text-link">
<span>
<a target="_blank" href=https://pikwizard.com/photo/global-currency-data-processing-visualization/c5a2a147844d0cff8a10bec83c0102c3/>PikWizard</a>
</span>
</span>
<span class="image-link">
<span
style="margin: 0 0 20px 0; display: inline-block; vertical-align: middle; width: 100%;"
>
<a
target="_blank"
href="https://pikwizard.com/photo/global-currency-data-processing-visualization/c5a2a147844d0cff8a10bec83c0102c3/"
style="text-decoration: none; font-size: 10px; margin: 0;"
>
<img src="https://pikwizard.com/pw/medium/c5a2a147844d0cff8a10bec83c0102c3.jpg" style="margin: 0; width: 100%;" alt="" />
<p style="font-size: 12px; margin: 0;">PikWizard</p>
</a>
</span>
</span>
Free (free of charge)
Free for personal and commercial use.
Author: People Creations